Immigrants from Ukraine vs Chinese In Labor Force | Age 45-54
COMPARE
Immigrants from Ukraine
Chinese
In Labor Force | Age 45-54
In Labor Force | Age 45-54 Comparison
Immigrants from Ukraine
Chinese
83.0%
IN LABOR FORCE | AGE 45-54
82.9/ 100
METRIC RATING
132nd/ 347
METRIC RANK
84.1%
IN LABOR FORCE | AGE 45-54
99.9/ 100
METRIC RATING
13th/ 347
METRIC RANK
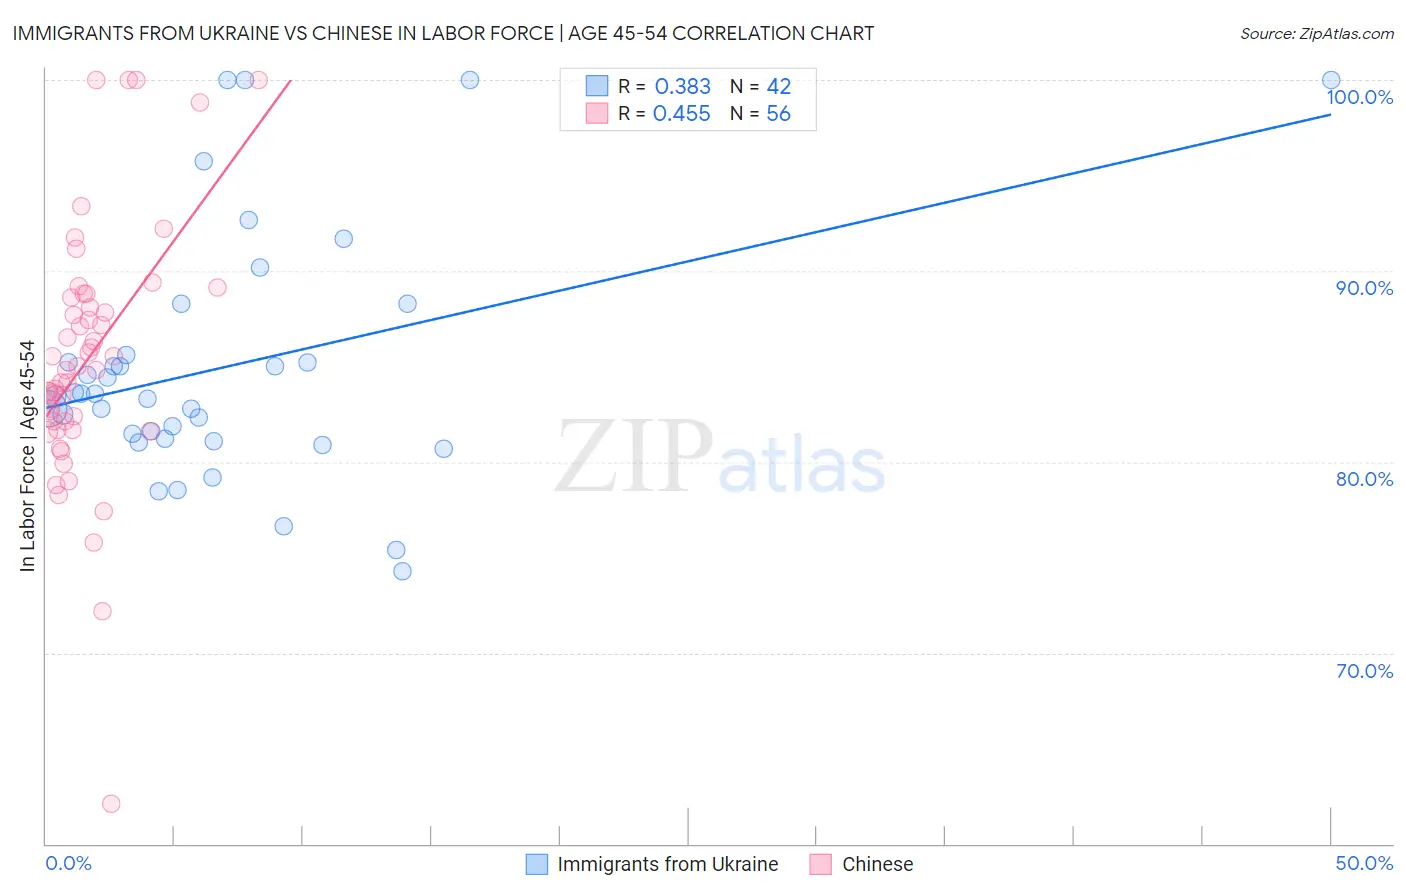
Immigrants from Ukraine vs Chinese In Labor Force | Age 45-54 Correlation Chart
The statistical analysis conducted on geographies consisting of 289,631,932 people shows a mild positive correlation between the proportion of Immigrants from Ukraine and labor force participation rate among population between the ages 45 and 54 in the United States with a correlation coefficient (R) of 0.383 and weighted average of 83.0%. Similarly, the statistical analysis conducted on geographies consisting of 64,795,821 people shows a moderate positive correlation between the proportion of Chinese and labor force participation rate among population between the ages 45 and 54 in the United States with a correlation coefficient (R) of 0.455 and weighted average of 84.1%, a difference of 1.3%.
In Labor Force | Age 45-54 Correlation Summary
| Measurement | Immigrants from Ukraine | Chinese |
| Minimum | 74.3% | 62.1% |
| Maximum | 100.0% | 100.0% |
| Range | 25.7% | 37.9% |
| Mean | 85.0% | 85.5% |
| Median | 83.5% | 84.9% |
| Interquartile 25% (IQ1) | 81.2% | 81.9% |
| Interquartile 75% (IQ3) | 85.6% | 88.7% |
| Interquartile Range (IQR) | 4.3% | 6.8% |
| Standard Deviation (Sample) | 6.5% | 6.8% |
| Standard Deviation (Population) | 6.4% | 6.7% |
Similar Demographics by In Labor Force | Age 45-54
Demographics Similar to Immigrants from Ukraine by In Labor Force | Age 45-54
In terms of in labor force | age 45-54, the demographic groups most similar to Immigrants from Ukraine are Liberian (83.0%, a difference of 0.0%), Finnish (83.1%, a difference of 0.010%), Sudanese (83.0%, a difference of 0.010%), Immigrants from Northern Europe (83.1%, a difference of 0.030%), and Immigrants from Israel (83.1%, a difference of 0.030%).
| Demographics | Rating | Rank | In Labor Force | Age 45-54 |
| Immigrants | Iran | 87.2 /100 | #125 | Excellent 83.1% |
| Immigrants | Belgium | 86.4 /100 | #126 | Excellent 83.1% |
| Immigrants | Jordan | 85.2 /100 | #127 | Excellent 83.1% |
| Germans | 85.1 /100 | #128 | Excellent 83.1% |
| Immigrants | Northern Europe | 85.1 /100 | #129 | Excellent 83.1% |
| Immigrants | Israel | 84.7 /100 | #130 | Excellent 83.1% |
| Finns | 83.3 /100 | #131 | Excellent 83.1% |
| Immigrants | Ukraine | 82.9 /100 | #132 | Excellent 83.0% |
| Liberians | 82.7 /100 | #133 | Excellent 83.0% |
| Sudanese | 82.0 /100 | #134 | Excellent 83.0% |
| Austrians | 81.3 /100 | #135 | Excellent 83.0% |
| Immigrants | Kazakhstan | 81.0 /100 | #136 | Excellent 83.0% |
| Immigrants | Spain | 80.4 /100 | #137 | Excellent 83.0% |
| Ghanaians | 79.5 /100 | #138 | Good 83.0% |
| Scandinavians | 78.5 /100 | #139 | Good 83.0% |
Demographics Similar to Chinese by In Labor Force | Age 45-54
In terms of in labor force | age 45-54, the demographic groups most similar to Chinese are Cambodian (84.1%, a difference of 0.030%), Cypriot (84.1%, a difference of 0.090%), Bulgarian (84.2%, a difference of 0.11%), Immigrants from Nepal (84.0%, a difference of 0.11%), and Zimbabwean (84.0%, a difference of 0.13%).
| Demographics | Rating | Rank | In Labor Force | Age 45-54 |
| Immigrants | India | 100.0 /100 | #6 | Exceptional 84.7% |
| Immigrants | Cameroon | 100.0 /100 | #7 | Exceptional 84.6% |
| Sierra Leoneans | 100.0 /100 | #8 | Exceptional 84.5% |
| Immigrants | Sierra Leone | 100.0 /100 | #9 | Exceptional 84.4% |
| Norwegians | 100.0 /100 | #10 | Exceptional 84.4% |
| Thais | 100.0 /100 | #11 | Exceptional 84.3% |
| Bulgarians | 100.0 /100 | #12 | Exceptional 84.2% |
| Chinese | 99.9 /100 | #13 | Exceptional 84.1% |
| Cambodians | 99.9 /100 | #14 | Exceptional 84.1% |
| Cypriots | 99.9 /100 | #15 | Exceptional 84.1% |
| Immigrants | Nepal | 99.9 /100 | #16 | Exceptional 84.0% |
| Zimbabweans | 99.9 /100 | #17 | Exceptional 84.0% |
| Immigrants | South Central Asia | 99.9 /100 | #18 | Exceptional 84.0% |
| Czechs | 99.8 /100 | #19 | Exceptional 83.9% |
| Immigrants | Eastern Africa | 99.8 /100 | #20 | Exceptional 83.9% |