Immigrants from Austria vs Syrian In Labor Force | Age 20-24
COMPARE
Immigrants from Austria
Syrian
In Labor Force | Age 20-24
In Labor Force | Age 20-24 Comparison
Immigrants from Austria
Syrians
75.6%
IN LABOR FORCE | AGE 20-24
88.8/ 100
METRIC RATING
130th/ 347
METRIC RANK
75.0%
IN LABOR FORCE | AGE 20-24
49.5/ 100
METRIC RATING
175th/ 347
METRIC RANK
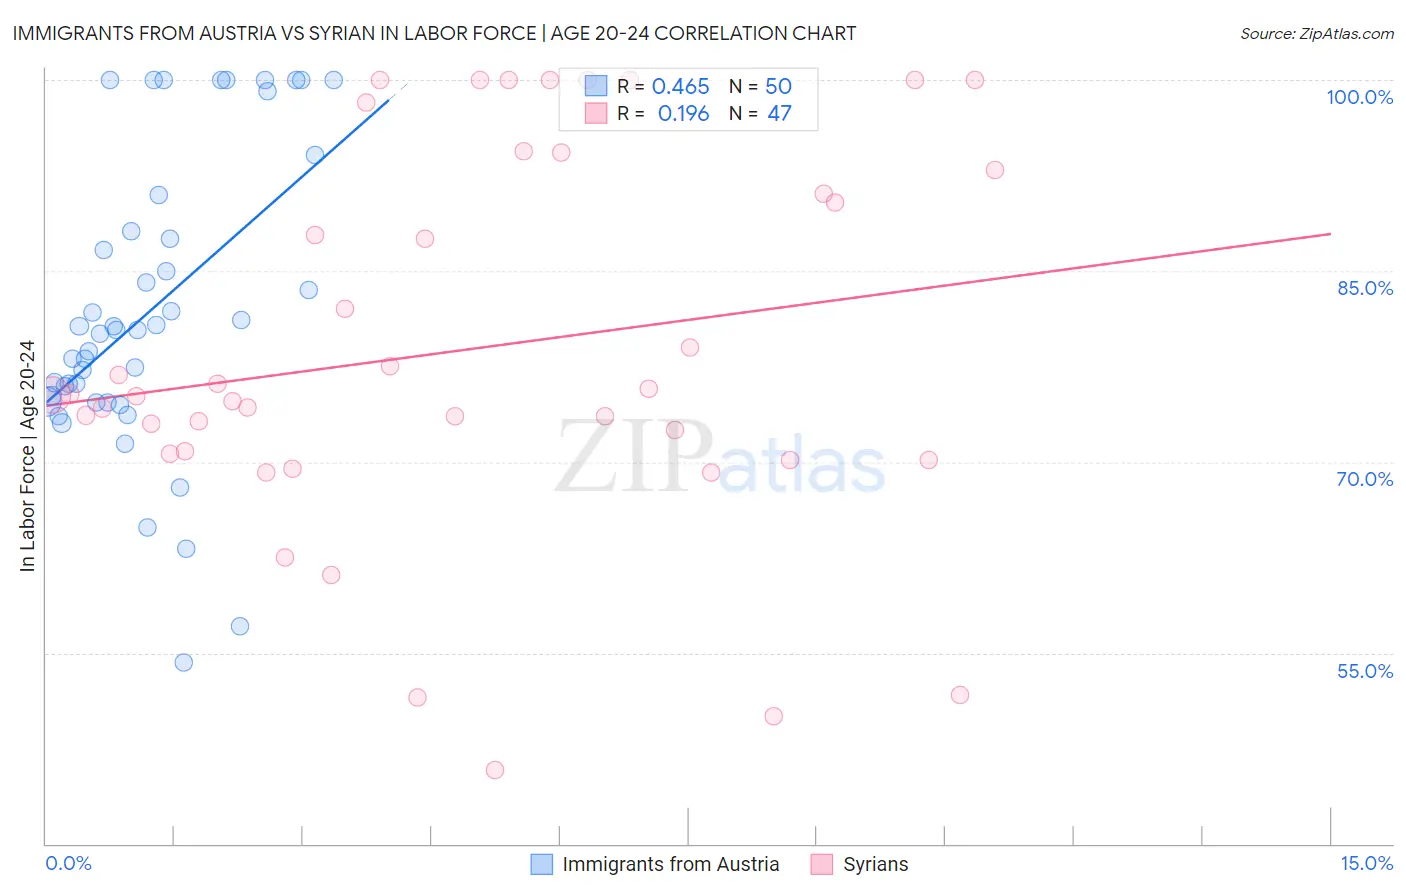
Immigrants from Austria vs Syrian In Labor Force | Age 20-24 Correlation Chart
The statistical analysis conducted on geographies consisting of 167,871,666 people shows a moderate positive correlation between the proportion of Immigrants from Austria and labor force participation rate among population between the ages 20 and 24 in the United States with a correlation coefficient (R) of 0.465 and weighted average of 75.6%. Similarly, the statistical analysis conducted on geographies consisting of 266,259,470 people shows a poor positive correlation between the proportion of Syrians and labor force participation rate among population between the ages 20 and 24 in the United States with a correlation coefficient (R) of 0.196 and weighted average of 75.0%, a difference of 0.77%.
In Labor Force | Age 20-24 Correlation Summary
| Measurement | Immigrants from Austria | Syrian |
| Minimum | 54.3% | 45.8% |
| Maximum | 100.0% | 100.0% |
| Range | 45.7% | 54.2% |
| Mean | 81.9% | 78.8% |
| Median | 80.3% | 75.3% |
| Interquartile 25% (IQ1) | 74.7% | 70.6% |
| Interquartile 75% (IQ3) | 88.1% | 92.9% |
| Interquartile Range (IQR) | 13.4% | 22.3% |
| Standard Deviation (Sample) | 11.6% | 14.7% |
| Standard Deviation (Population) | 11.5% | 14.5% |
Similar Demographics by In Labor Force | Age 20-24
Demographics Similar to Immigrants from Austria by In Labor Force | Age 20-24
In terms of in labor force | age 20-24, the demographic groups most similar to Immigrants from Austria are Iroquois (75.6%, a difference of 0.010%), Immigrants from Jordan (75.6%, a difference of 0.010%), Palestinian (75.6%, a difference of 0.010%), Immigrants from Afghanistan (75.6%, a difference of 0.020%), and Zimbabwean (75.6%, a difference of 0.020%).
| Demographics | Rating | Rank | In Labor Force | Age 20-24 |
| Immigrants | Bulgaria | 94.1 /100 | #123 | Exceptional 75.8% |
| Immigrants | Sierra Leone | 93.8 /100 | #124 | Exceptional 75.8% |
| Immigrants | Scotland | 93.7 /100 | #125 | Exceptional 75.8% |
| Brazilians | 93.0 /100 | #126 | Exceptional 75.8% |
| Sub-Saharan Africans | 90.9 /100 | #127 | Exceptional 75.7% |
| Immigrants | Afghanistan | 89.4 /100 | #128 | Excellent 75.6% |
| Iroquois | 89.1 /100 | #129 | Excellent 75.6% |
| Immigrants | Austria | 88.8 /100 | #130 | Excellent 75.6% |
| Immigrants | Jordan | 88.5 /100 | #131 | Excellent 75.6% |
| Palestinians | 88.4 /100 | #132 | Excellent 75.6% |
| Zimbabweans | 88.2 /100 | #133 | Excellent 75.6% |
| Estonians | 87.1 /100 | #134 | Excellent 75.6% |
| Yaqui | 85.5 /100 | #135 | Excellent 75.5% |
| Immigrants | Brazil | 84.8 /100 | #136 | Excellent 75.5% |
| Jordanians | 84.8 /100 | #137 | Excellent 75.5% |
Demographics Similar to Syrians by In Labor Force | Age 20-24
In terms of in labor force | age 20-24, the demographic groups most similar to Syrians are Immigrants from Croatia (75.1%, a difference of 0.010%), South African (75.0%, a difference of 0.010%), Central American (75.0%, a difference of 0.010%), Cajun (75.1%, a difference of 0.020%), and Yakama (75.1%, a difference of 0.020%).
| Demographics | Rating | Rank | In Labor Force | Age 20-24 |
| Immigrants | Western Africa | 56.7 /100 | #168 | Average 75.1% |
| Immigrants | Philippines | 55.8 /100 | #169 | Average 75.1% |
| Mexicans | 52.1 /100 | #170 | Average 75.1% |
| Cajuns | 51.1 /100 | #171 | Average 75.1% |
| Yakama | 50.8 /100 | #172 | Average 75.1% |
| Immigrants | Croatia | 50.2 /100 | #173 | Average 75.1% |
| South Africans | 50.0 /100 | #174 | Average 75.0% |
| Syrians | 49.5 /100 | #175 | Average 75.0% |
| Central Americans | 48.7 /100 | #176 | Average 75.0% |
| Immigrants | Mexico | 47.8 /100 | #177 | Average 75.0% |
| Immigrants | Central America | 45.0 /100 | #178 | Average 75.0% |
| Immigrants | Latvia | 44.1 /100 | #179 | Average 75.0% |
| Immigrants | Czechoslovakia | 44.0 /100 | #180 | Average 75.0% |
| Africans | 42.5 /100 | #181 | Average 75.0% |
| Immigrants | South Africa | 36.9 /100 | #182 | Fair 74.9% |