Italian vs Syrian In Labor Force | Age 20-24
COMPARE
Italian
Syrian
In Labor Force | Age 20-24
In Labor Force | Age 20-24 Comparison
Italians
Syrians
76.5%
IN LABOR FORCE | AGE 20-24
99.6/ 100
METRIC RATING
80th/ 347
METRIC RANK
75.0%
IN LABOR FORCE | AGE 20-24
49.5/ 100
METRIC RATING
175th/ 347
METRIC RANK
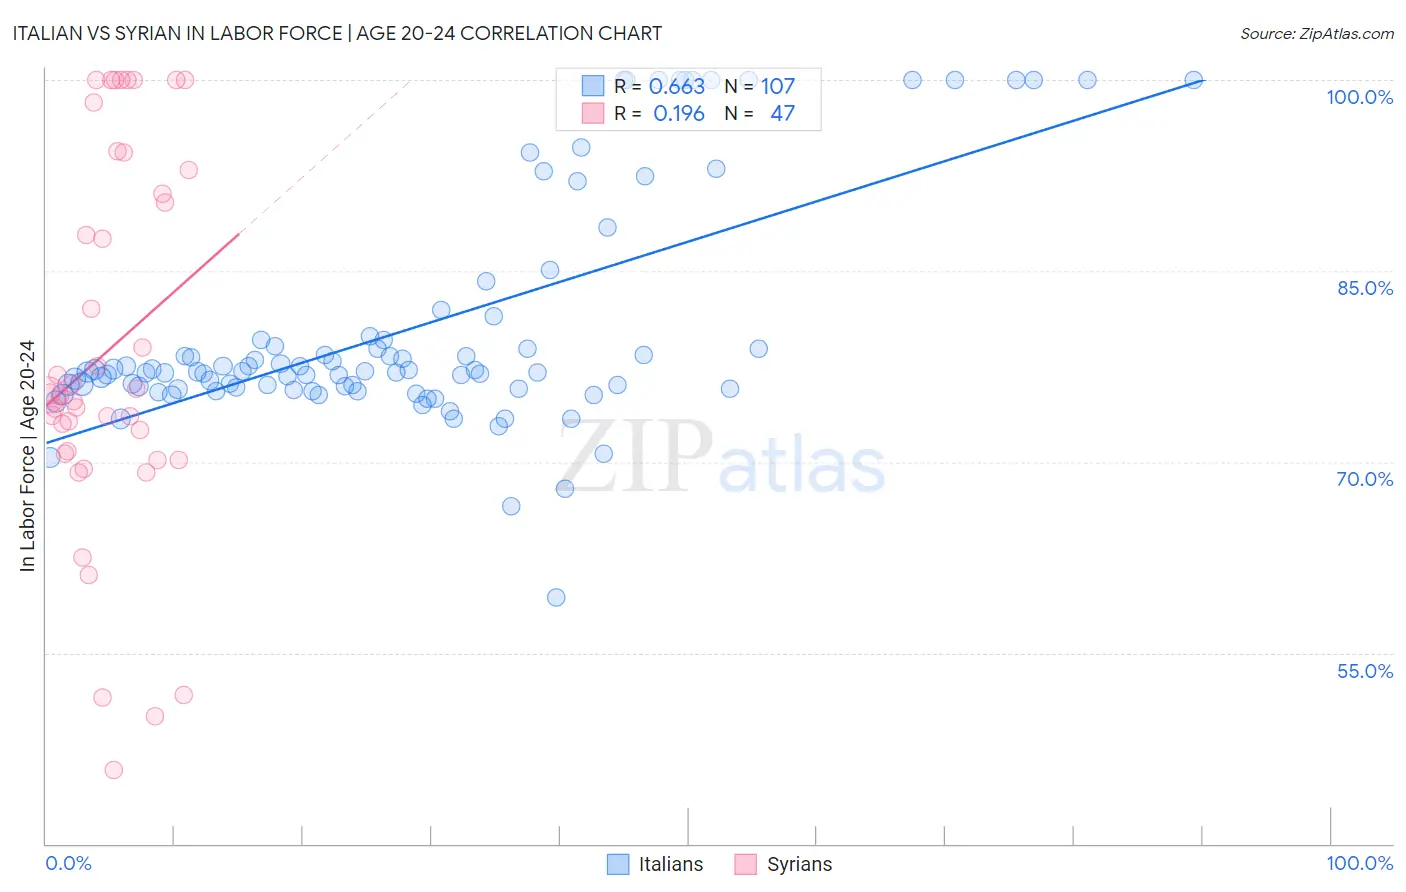
Italian vs Syrian In Labor Force | Age 20-24 Correlation Chart
The statistical analysis conducted on geographies consisting of 573,427,196 people shows a significant positive correlation between the proportion of Italians and labor force participation rate among population between the ages 20 and 24 in the United States with a correlation coefficient (R) of 0.663 and weighted average of 76.5%. Similarly, the statistical analysis conducted on geographies consisting of 266,259,470 people shows a poor positive correlation between the proportion of Syrians and labor force participation rate among population between the ages 20 and 24 in the United States with a correlation coefficient (R) of 0.196 and weighted average of 75.0%, a difference of 2.0%.
In Labor Force | Age 20-24 Correlation Summary
| Measurement | Italian | Syrian |
| Minimum | 59.3% | 45.8% |
| Maximum | 100.0% | 100.0% |
| Range | 40.7% | 54.2% |
| Mean | 80.5% | 78.8% |
| Median | 77.1% | 75.3% |
| Interquartile 25% (IQ1) | 75.7% | 70.6% |
| Interquartile 75% (IQ3) | 79.6% | 92.9% |
| Interquartile Range (IQR) | 3.9% | 22.3% |
| Standard Deviation (Sample) | 9.1% | 14.7% |
| Standard Deviation (Population) | 9.0% | 14.5% |
Similar Demographics by In Labor Force | Age 20-24
Demographics Similar to Italians by In Labor Force | Age 20-24
In terms of in labor force | age 20-24, the demographic groups most similar to Italians are Basque (76.5%, a difference of 0.020%), Hmong (76.5%, a difference of 0.020%), Immigrants from Zaire (76.6%, a difference of 0.030%), Immigrants from Cameroon (76.6%, a difference of 0.050%), and Canadian (76.6%, a difference of 0.050%).
| Demographics | Rating | Rank | In Labor Force | Age 20-24 |
| British | 99.8 /100 | #73 | Exceptional 76.7% |
| Cree | 99.7 /100 | #74 | Exceptional 76.6% |
| Immigrants | Middle Africa | 99.7 /100 | #75 | Exceptional 76.6% |
| Immigrants | Moldova | 99.6 /100 | #76 | Exceptional 76.6% |
| Immigrants | Cameroon | 99.6 /100 | #77 | Exceptional 76.6% |
| Canadians | 99.6 /100 | #78 | Exceptional 76.6% |
| Immigrants | Zaire | 99.6 /100 | #79 | Exceptional 76.6% |
| Italians | 99.6 /100 | #80 | Exceptional 76.5% |
| Basques | 99.5 /100 | #81 | Exceptional 76.5% |
| Hmong | 99.5 /100 | #82 | Exceptional 76.5% |
| Carpatho Rusyns | 99.4 /100 | #83 | Exceptional 76.5% |
| Austrians | 99.4 /100 | #84 | Exceptional 76.5% |
| Portuguese | 99.3 /100 | #85 | Exceptional 76.4% |
| Immigrants | Iraq | 99.3 /100 | #86 | Exceptional 76.4% |
| Immigrants | Thailand | 99.3 /100 | #87 | Exceptional 76.4% |
Demographics Similar to Syrians by In Labor Force | Age 20-24
In terms of in labor force | age 20-24, the demographic groups most similar to Syrians are Immigrants from Croatia (75.1%, a difference of 0.010%), South African (75.0%, a difference of 0.010%), Central American (75.0%, a difference of 0.010%), Cajun (75.1%, a difference of 0.020%), and Yakama (75.1%, a difference of 0.020%).
| Demographics | Rating | Rank | In Labor Force | Age 20-24 |
| Immigrants | Western Africa | 56.7 /100 | #168 | Average 75.1% |
| Immigrants | Philippines | 55.8 /100 | #169 | Average 75.1% |
| Mexicans | 52.1 /100 | #170 | Average 75.1% |
| Cajuns | 51.1 /100 | #171 | Average 75.1% |
| Yakama | 50.8 /100 | #172 | Average 75.1% |
| Immigrants | Croatia | 50.2 /100 | #173 | Average 75.1% |
| South Africans | 50.0 /100 | #174 | Average 75.0% |
| Syrians | 49.5 /100 | #175 | Average 75.0% |
| Central Americans | 48.7 /100 | #176 | Average 75.0% |
| Immigrants | Mexico | 47.8 /100 | #177 | Average 75.0% |
| Immigrants | Central America | 45.0 /100 | #178 | Average 75.0% |
| Immigrants | Latvia | 44.1 /100 | #179 | Average 75.0% |
| Immigrants | Czechoslovakia | 44.0 /100 | #180 | Average 75.0% |
| Africans | 42.5 /100 | #181 | Average 75.0% |
| Immigrants | South Africa | 36.9 /100 | #182 | Fair 74.9% |