Immigrants from Iran vs Immigrants from Chile In Labor Force | Age 30-34
COMPARE
Immigrants from Iran
Immigrants from Chile
In Labor Force | Age 30-34
In Labor Force | Age 30-34 Comparison
Immigrants from Iran
Immigrants from Chile
85.4%
IN LABOR FORCE | AGE 30-34
99.2/ 100
METRIC RATING
69th/ 347
METRIC RANK
85.0%
IN LABOR FORCE | AGE 30-34
89.2/ 100
METRIC RATING
134th/ 347
METRIC RANK
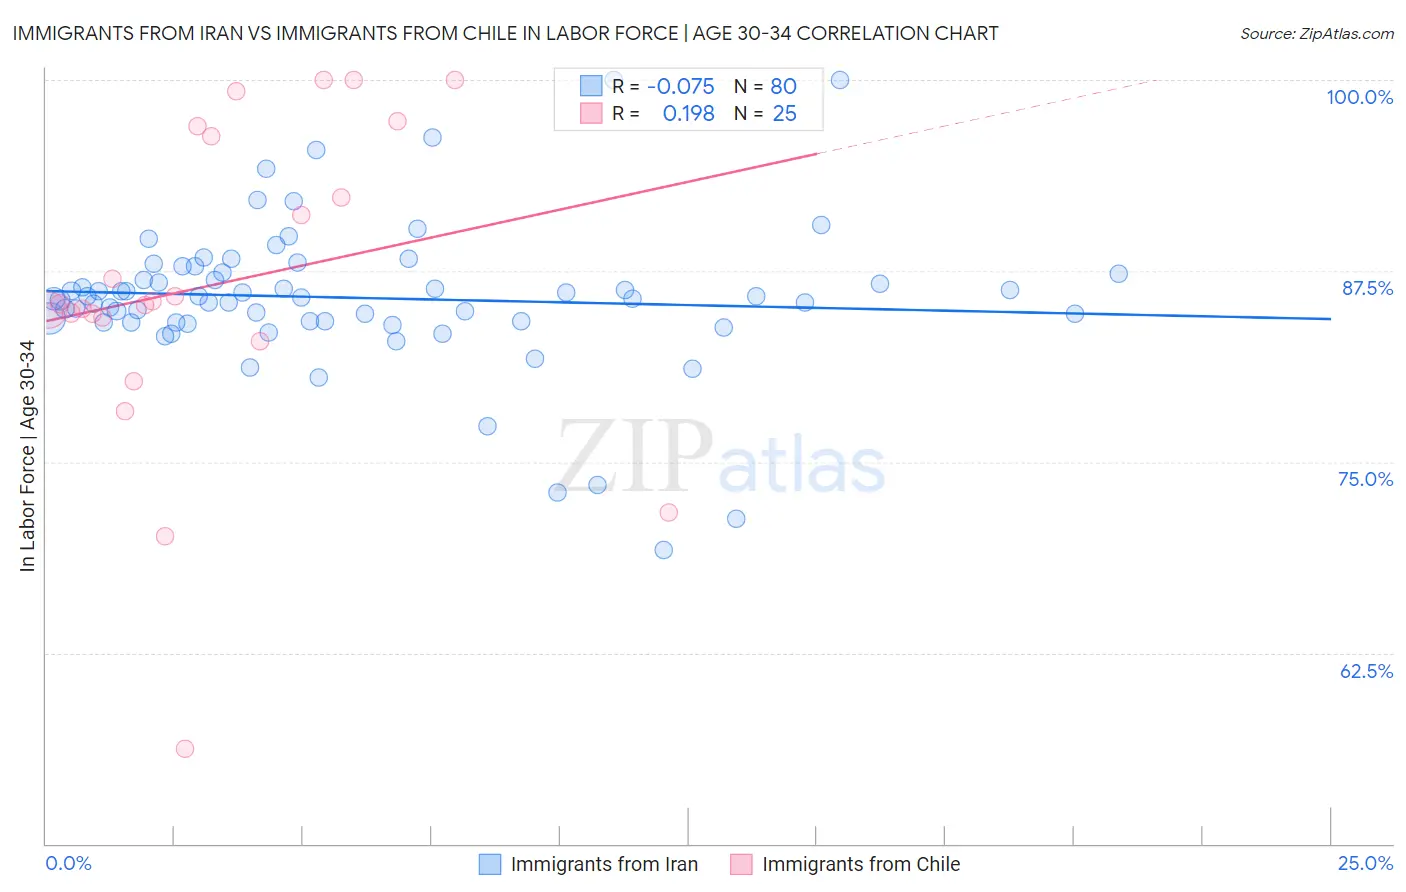
Immigrants from Iran vs Immigrants from Chile In Labor Force | Age 30-34 Correlation Chart
The statistical analysis conducted on geographies consisting of 279,826,659 people shows a slight negative correlation between the proportion of Immigrants from Iran and labor force participation rate among population between the ages 30 and 34 in the United States with a correlation coefficient (R) of -0.075 and weighted average of 85.4%. Similarly, the statistical analysis conducted on geographies consisting of 218,612,214 people shows a poor positive correlation between the proportion of Immigrants from Chile and labor force participation rate among population between the ages 30 and 34 in the United States with a correlation coefficient (R) of 0.198 and weighted average of 85.0%, a difference of 0.47%.
In Labor Force | Age 30-34 Correlation Summary
| Measurement | Immigrants from Iran | Immigrants from Chile |
| Minimum | 69.2% | 56.2% |
| Maximum | 100.0% | 100.0% |
| Range | 30.8% | 43.8% |
| Mean | 85.7% | 86.6% |
| Median | 85.8% | 85.3% |
| Interquartile 25% (IQ1) | 84.2% | 83.7% |
| Interquartile 75% (IQ3) | 87.3% | 96.6% |
| Interquartile Range (IQR) | 3.2% | 13.0% |
| Standard Deviation (Sample) | 4.9% | 10.5% |
| Standard Deviation (Population) | 4.9% | 10.3% |
Similar Demographics by In Labor Force | Age 30-34
Demographics Similar to Immigrants from Iran by In Labor Force | Age 30-34
In terms of in labor force | age 30-34, the demographic groups most similar to Immigrants from Iran are Brazilian (85.4%, a difference of 0.020%), Immigrants from Eastern Europe (85.4%, a difference of 0.030%), Immigrants from Japan (85.4%, a difference of 0.030%), Immigrants from China (85.4%, a difference of 0.030%), and Indian (Asian) (85.4%, a difference of 0.030%).
| Demographics | Rating | Rank | In Labor Force | Age 30-34 |
| Soviet Union | 99.4 /100 | #62 | Exceptional 85.5% |
| Macedonians | 99.4 /100 | #63 | Exceptional 85.5% |
| Italians | 99.4 /100 | #64 | Exceptional 85.4% |
| Senegalese | 99.4 /100 | #65 | Exceptional 85.4% |
| Ghanaians | 99.4 /100 | #66 | Exceptional 85.4% |
| Kenyans | 99.3 /100 | #67 | Exceptional 85.4% |
| Immigrants | Eastern Europe | 99.3 /100 | #68 | Exceptional 85.4% |
| Immigrants | Iran | 99.2 /100 | #69 | Exceptional 85.4% |
| Brazilians | 99.1 /100 | #70 | Exceptional 85.4% |
| Immigrants | Japan | 99.1 /100 | #71 | Exceptional 85.4% |
| Immigrants | China | 99.0 /100 | #72 | Exceptional 85.4% |
| Indians (Asian) | 99.0 /100 | #73 | Exceptional 85.4% |
| Maltese | 99.0 /100 | #74 | Exceptional 85.4% |
| Immigrants | Czechoslovakia | 99.0 /100 | #75 | Exceptional 85.4% |
| Iranians | 99.0 /100 | #76 | Exceptional 85.4% |
Demographics Similar to Immigrants from Chile by In Labor Force | Age 30-34
In terms of in labor force | age 30-34, the demographic groups most similar to Immigrants from Chile are Immigrants from Asia (85.0%, a difference of 0.0%), Chinese (85.0%, a difference of 0.010%), Immigrants from Israel (85.0%, a difference of 0.010%), New Zealander (85.0%, a difference of 0.010%), and Jordanian (85.0%, a difference of 0.010%).
| Demographics | Rating | Rank | In Labor Force | Age 30-34 |
| Slavs | 90.7 /100 | #127 | Exceptional 85.0% |
| Immigrants | Argentina | 90.6 /100 | #128 | Exceptional 85.0% |
| Immigrants | Western Africa | 90.2 /100 | #129 | Exceptional 85.0% |
| Immigrants | Spain | 90.0 /100 | #130 | Exceptional 85.0% |
| Chinese | 89.6 /100 | #131 | Excellent 85.0% |
| Immigrants | Israel | 89.5 /100 | #132 | Excellent 85.0% |
| New Zealanders | 89.5 /100 | #133 | Excellent 85.0% |
| Immigrants | Chile | 89.2 /100 | #134 | Excellent 85.0% |
| Immigrants | Asia | 88.9 /100 | #135 | Excellent 85.0% |
| Jordanians | 88.6 /100 | #136 | Excellent 85.0% |
| South Africans | 88.0 /100 | #137 | Excellent 85.0% |
| Sri Lankans | 87.8 /100 | #138 | Excellent 85.0% |
| Bhutanese | 87.5 /100 | #139 | Excellent 85.0% |
| Immigrants | Vietnam | 86.5 /100 | #140 | Excellent 85.0% |
| Chileans | 85.3 /100 | #141 | Excellent 84.9% |