Immigrants from Kuwait vs Immigrants from Chile In Labor Force | Age 30-34
COMPARE
Immigrants from Kuwait
Immigrants from Chile
In Labor Force | Age 30-34
In Labor Force | Age 30-34 Comparison
Immigrants from Kuwait
Immigrants from Chile
85.1%
IN LABOR FORCE | AGE 30-34
92.6/ 100
METRIC RATING
122nd/ 347
METRIC RANK
85.0%
IN LABOR FORCE | AGE 30-34
89.2/ 100
METRIC RATING
134th/ 347
METRIC RANK
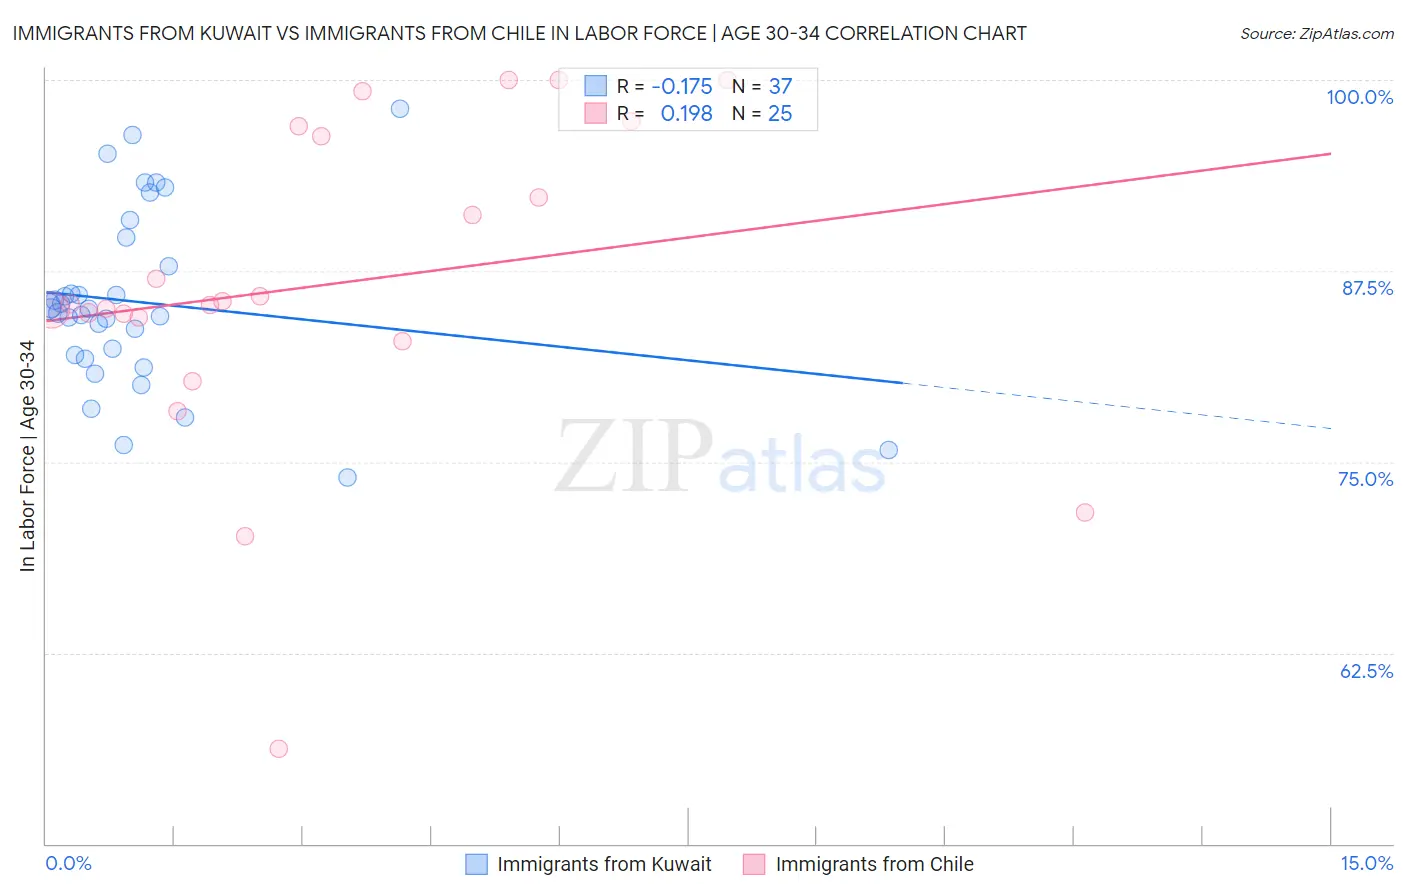
Immigrants from Kuwait vs Immigrants from Chile In Labor Force | Age 30-34 Correlation Chart
The statistical analysis conducted on geographies consisting of 136,877,568 people shows a poor negative correlation between the proportion of Immigrants from Kuwait and labor force participation rate among population between the ages 30 and 34 in the United States with a correlation coefficient (R) of -0.175 and weighted average of 85.1%. Similarly, the statistical analysis conducted on geographies consisting of 218,612,214 people shows a poor positive correlation between the proportion of Immigrants from Chile and labor force participation rate among population between the ages 30 and 34 in the United States with a correlation coefficient (R) of 0.198 and weighted average of 85.0%, a difference of 0.070%.
In Labor Force | Age 30-34 Correlation Summary
| Measurement | Immigrants from Kuwait | Immigrants from Chile |
| Minimum | 74.0% | 56.2% |
| Maximum | 98.1% | 100.0% |
| Range | 24.1% | 43.8% |
| Mean | 85.4% | 86.6% |
| Median | 85.0% | 85.3% |
| Interquartile 25% (IQ1) | 81.9% | 83.7% |
| Interquartile 75% (IQ3) | 88.7% | 96.6% |
| Interquartile Range (IQR) | 6.9% | 13.0% |
| Standard Deviation (Sample) | 5.7% | 10.5% |
| Standard Deviation (Population) | 5.7% | 10.3% |
Demographics Similar to Immigrants from Kuwait and Immigrants from Chile by In Labor Force | Age 30-34
In terms of in labor force | age 30-34, the demographic groups most similar to Immigrants from Kuwait are Armenian (85.0%, a difference of 0.010%), Australian (85.0%, a difference of 0.010%), Asian (85.1%, a difference of 0.020%), Immigrants from Southern Europe (85.1%, a difference of 0.020%), and Immigrants from Egypt (85.1%, a difference of 0.020%). Similarly, the demographic groups most similar to Immigrants from Chile are Immigrants from Asia (85.0%, a difference of 0.0%), Chinese (85.0%, a difference of 0.010%), Immigrants from Israel (85.0%, a difference of 0.010%), New Zealander (85.0%, a difference of 0.010%), and Jordanian (85.0%, a difference of 0.010%).
| Demographics | Rating | Rank | In Labor Force | Age 30-34 |
| Immigrants | Malaysia | 94.2 /100 | #118 | Exceptional 85.1% |
| Asians | 93.4 /100 | #119 | Exceptional 85.1% |
| Immigrants | Southern Europe | 93.3 /100 | #120 | Exceptional 85.1% |
| Immigrants | Egypt | 93.2 /100 | #121 | Exceptional 85.1% |
| Immigrants | Kuwait | 92.6 /100 | #122 | Exceptional 85.1% |
| Armenians | 92.2 /100 | #123 | Exceptional 85.0% |
| Australians | 92.0 /100 | #124 | Exceptional 85.0% |
| Immigrants | Jordan | 91.5 /100 | #125 | Exceptional 85.0% |
| Austrians | 90.9 /100 | #126 | Exceptional 85.0% |
| Slavs | 90.7 /100 | #127 | Exceptional 85.0% |
| Immigrants | Argentina | 90.6 /100 | #128 | Exceptional 85.0% |
| Immigrants | Western Africa | 90.2 /100 | #129 | Exceptional 85.0% |
| Immigrants | Spain | 90.0 /100 | #130 | Exceptional 85.0% |
| Chinese | 89.6 /100 | #131 | Excellent 85.0% |
| Immigrants | Israel | 89.5 /100 | #132 | Excellent 85.0% |
| New Zealanders | 89.5 /100 | #133 | Excellent 85.0% |
| Immigrants | Chile | 89.2 /100 | #134 | Excellent 85.0% |
| Immigrants | Asia | 88.9 /100 | #135 | Excellent 85.0% |
| Jordanians | 88.6 /100 | #136 | Excellent 85.0% |
| South Africans | 88.0 /100 | #137 | Excellent 85.0% |
| Sri Lankans | 87.8 /100 | #138 | Excellent 85.0% |