Immigrants from Yemen vs Immigrants from Chile In Labor Force | Age 30-34
COMPARE
Immigrants from Yemen
Immigrants from Chile
In Labor Force | Age 30-34
In Labor Force | Age 30-34 Comparison
Immigrants from Yemen
Immigrants from Chile
78.2%
IN LABOR FORCE | AGE 30-34
0.0/ 100
METRIC RATING
341st/ 347
METRIC RANK
85.0%
IN LABOR FORCE | AGE 30-34
89.2/ 100
METRIC RATING
134th/ 347
METRIC RANK
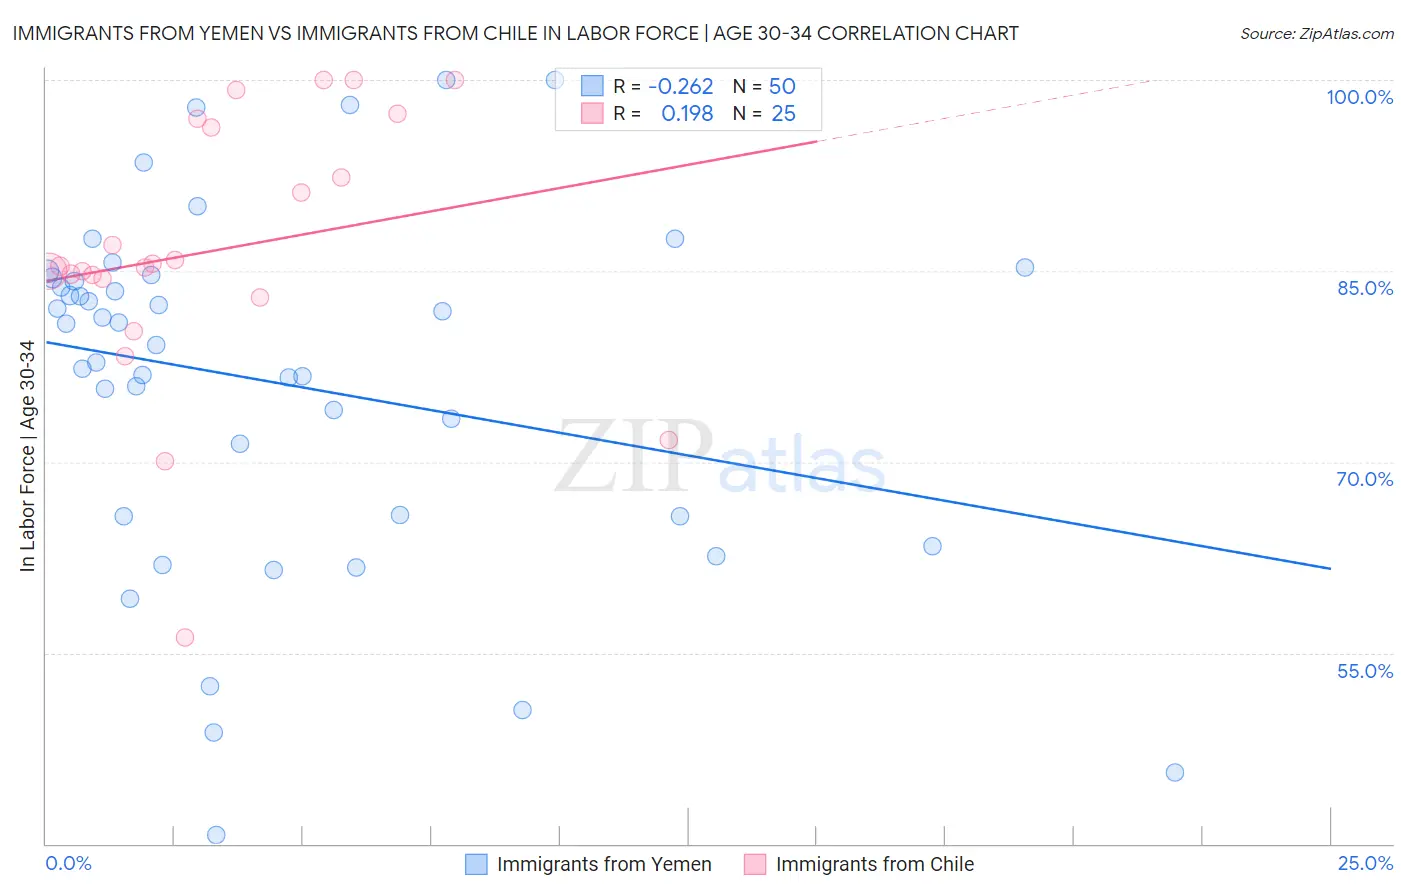
Immigrants from Yemen vs Immigrants from Chile In Labor Force | Age 30-34 Correlation Chart
The statistical analysis conducted on geographies consisting of 82,432,494 people shows a weak negative correlation between the proportion of Immigrants from Yemen and labor force participation rate among population between the ages 30 and 34 in the United States with a correlation coefficient (R) of -0.262 and weighted average of 78.2%. Similarly, the statistical analysis conducted on geographies consisting of 218,612,214 people shows a poor positive correlation between the proportion of Immigrants from Chile and labor force participation rate among population between the ages 30 and 34 in the United States with a correlation coefficient (R) of 0.198 and weighted average of 85.0%, a difference of 8.7%.
In Labor Force | Age 30-34 Correlation Summary
| Measurement | Immigrants from Yemen | Immigrants from Chile |
| Minimum | 40.7% | 56.2% |
| Maximum | 100.0% | 100.0% |
| Range | 59.3% | 43.8% |
| Mean | 76.2% | 86.6% |
| Median | 80.0% | 85.3% |
| Interquartile 25% (IQ1) | 65.7% | 83.7% |
| Interquartile 75% (IQ3) | 84.4% | 96.6% |
| Interquartile Range (IQR) | 18.7% | 13.0% |
| Standard Deviation (Sample) | 13.9% | 10.5% |
| Standard Deviation (Population) | 13.8% | 10.3% |
Similar Demographics by In Labor Force | Age 30-34
Demographics Similar to Immigrants from Yemen by In Labor Force | Age 30-34
In terms of in labor force | age 30-34, the demographic groups most similar to Immigrants from Yemen are Tohono O'odham (77.7%, a difference of 0.57%), Ute (78.9%, a difference of 0.98%), Apache (79.0%, a difference of 1.1%), Pima (79.0%, a difference of 1.1%), and Lumbee (77.3%, a difference of 1.2%).
| Demographics | Rating | Rank | In Labor Force | Age 30-34 |
| Inupiat | 0.0 /100 | #333 | Tragic 79.7% |
| Hopi | 0.0 /100 | #334 | Tragic 79.3% |
| Marshallese | 0.0 /100 | #335 | Tragic 79.2% |
| Natives/Alaskans | 0.0 /100 | #336 | Tragic 79.2% |
| Yakama | 0.0 /100 | #337 | Tragic 79.1% |
| Pima | 0.0 /100 | #338 | Tragic 79.0% |
| Apache | 0.0 /100 | #339 | Tragic 79.0% |
| Ute | 0.0 /100 | #340 | Tragic 78.9% |
| Immigrants | Yemen | 0.0 /100 | #341 | Tragic 78.2% |
| Tohono O'odham | 0.0 /100 | #342 | Tragic 77.7% |
| Lumbee | 0.0 /100 | #343 | Tragic 77.3% |
| Yuman | 0.0 /100 | #344 | Tragic 77.1% |
| Yup'ik | 0.0 /100 | #345 | Tragic 76.4% |
| Crow | 0.0 /100 | #346 | Tragic 75.9% |
| Navajo | 0.0 /100 | #347 | Tragic 73.8% |
Demographics Similar to Immigrants from Chile by In Labor Force | Age 30-34
In terms of in labor force | age 30-34, the demographic groups most similar to Immigrants from Chile are Immigrants from Asia (85.0%, a difference of 0.0%), Chinese (85.0%, a difference of 0.010%), Immigrants from Israel (85.0%, a difference of 0.010%), New Zealander (85.0%, a difference of 0.010%), and Jordanian (85.0%, a difference of 0.010%).
| Demographics | Rating | Rank | In Labor Force | Age 30-34 |
| Slavs | 90.7 /100 | #127 | Exceptional 85.0% |
| Immigrants | Argentina | 90.6 /100 | #128 | Exceptional 85.0% |
| Immigrants | Western Africa | 90.2 /100 | #129 | Exceptional 85.0% |
| Immigrants | Spain | 90.0 /100 | #130 | Exceptional 85.0% |
| Chinese | 89.6 /100 | #131 | Excellent 85.0% |
| Immigrants | Israel | 89.5 /100 | #132 | Excellent 85.0% |
| New Zealanders | 89.5 /100 | #133 | Excellent 85.0% |
| Immigrants | Chile | 89.2 /100 | #134 | Excellent 85.0% |
| Immigrants | Asia | 88.9 /100 | #135 | Excellent 85.0% |
| Jordanians | 88.6 /100 | #136 | Excellent 85.0% |
| South Africans | 88.0 /100 | #137 | Excellent 85.0% |
| Sri Lankans | 87.8 /100 | #138 | Excellent 85.0% |
| Bhutanese | 87.5 /100 | #139 | Excellent 85.0% |
| Immigrants | Vietnam | 86.5 /100 | #140 | Excellent 85.0% |
| Chileans | 85.3 /100 | #141 | Excellent 84.9% |