Immigrants from Iran vs Bermudan In Labor Force | Age 30-34
COMPARE
Immigrants from Iran
Bermudan
In Labor Force | Age 30-34
In Labor Force | Age 30-34 Comparison
Immigrants from Iran
Bermudans
85.4%
IN LABOR FORCE | AGE 30-34
99.2/ 100
METRIC RATING
69th/ 347
METRIC RANK
85.9%
IN LABOR FORCE | AGE 30-34
100.0/ 100
METRIC RATING
22nd/ 347
METRIC RANK
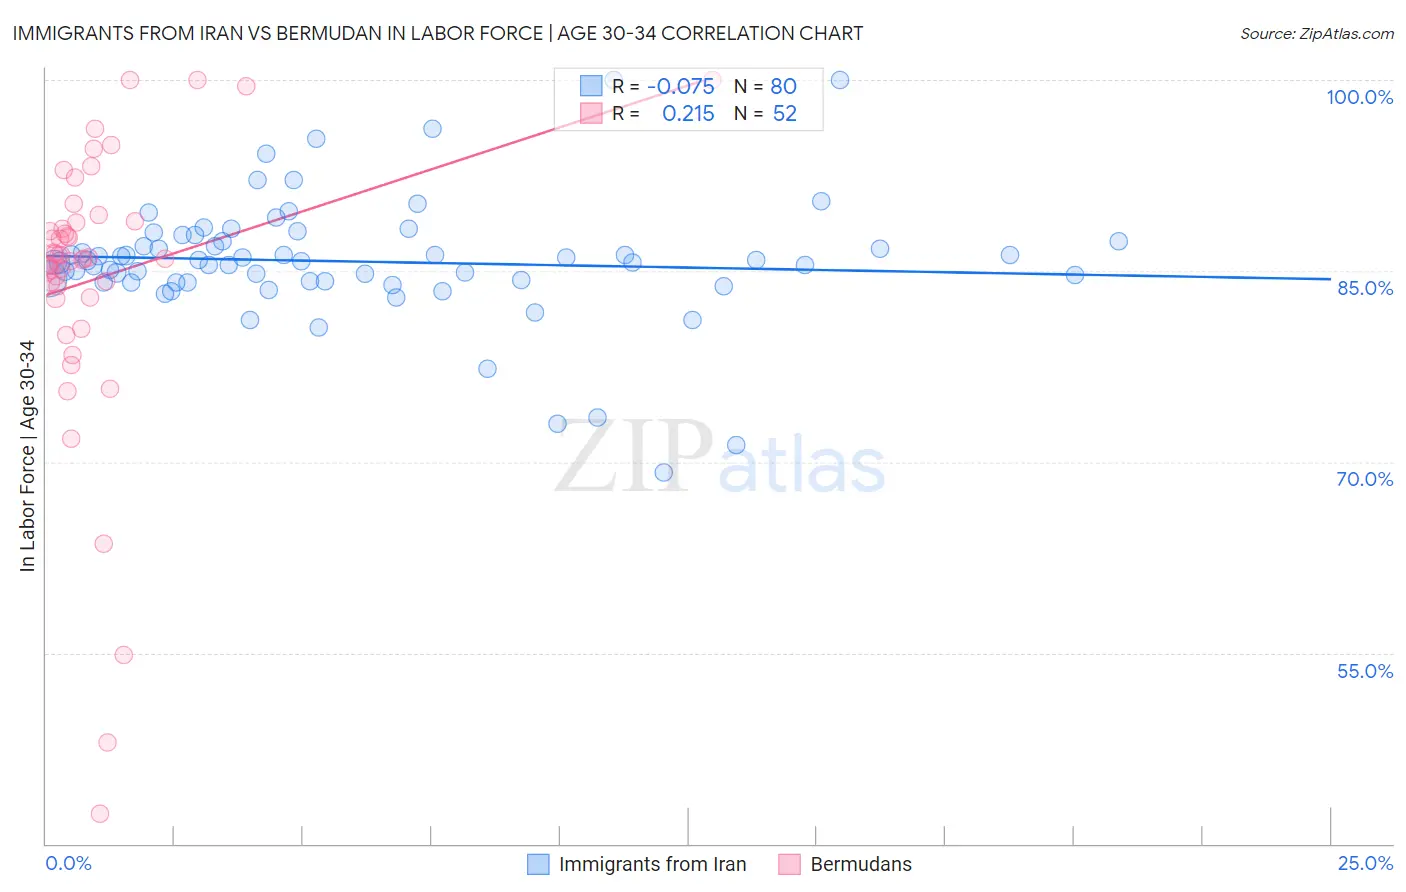
Immigrants from Iran vs Bermudan In Labor Force | Age 30-34 Correlation Chart
The statistical analysis conducted on geographies consisting of 279,826,659 people shows a slight negative correlation between the proportion of Immigrants from Iran and labor force participation rate among population between the ages 30 and 34 in the United States with a correlation coefficient (R) of -0.075 and weighted average of 85.4%. Similarly, the statistical analysis conducted on geographies consisting of 55,725,453 people shows a weak positive correlation between the proportion of Bermudans and labor force participation rate among population between the ages 30 and 34 in the United States with a correlation coefficient (R) of 0.215 and weighted average of 85.9%, a difference of 0.64%.
In Labor Force | Age 30-34 Correlation Summary
| Measurement | Immigrants from Iran | Bermudan |
| Minimum | 69.2% | 42.4% |
| Maximum | 100.0% | 100.0% |
| Range | 30.8% | 57.6% |
| Mean | 85.7% | 84.4% |
| Median | 85.8% | 86.0% |
| Interquartile 25% (IQ1) | 84.2% | 83.3% |
| Interquartile 75% (IQ3) | 87.3% | 88.8% |
| Interquartile Range (IQR) | 3.2% | 5.5% |
| Standard Deviation (Sample) | 4.9% | 11.4% |
| Standard Deviation (Population) | 4.9% | 11.2% |
Similar Demographics by In Labor Force | Age 30-34
Demographics Similar to Immigrants from Iran by In Labor Force | Age 30-34
In terms of in labor force | age 30-34, the demographic groups most similar to Immigrants from Iran are Brazilian (85.4%, a difference of 0.020%), Immigrants from Eastern Europe (85.4%, a difference of 0.030%), Immigrants from Japan (85.4%, a difference of 0.030%), Immigrants from China (85.4%, a difference of 0.030%), and Indian (Asian) (85.4%, a difference of 0.030%).
| Demographics | Rating | Rank | In Labor Force | Age 30-34 |
| Soviet Union | 99.4 /100 | #62 | Exceptional 85.5% |
| Macedonians | 99.4 /100 | #63 | Exceptional 85.5% |
| Italians | 99.4 /100 | #64 | Exceptional 85.4% |
| Senegalese | 99.4 /100 | #65 | Exceptional 85.4% |
| Ghanaians | 99.4 /100 | #66 | Exceptional 85.4% |
| Kenyans | 99.3 /100 | #67 | Exceptional 85.4% |
| Immigrants | Eastern Europe | 99.3 /100 | #68 | Exceptional 85.4% |
| Immigrants | Iran | 99.2 /100 | #69 | Exceptional 85.4% |
| Brazilians | 99.1 /100 | #70 | Exceptional 85.4% |
| Immigrants | Japan | 99.1 /100 | #71 | Exceptional 85.4% |
| Immigrants | China | 99.0 /100 | #72 | Exceptional 85.4% |
| Indians (Asian) | 99.0 /100 | #73 | Exceptional 85.4% |
| Maltese | 99.0 /100 | #74 | Exceptional 85.4% |
| Immigrants | Czechoslovakia | 99.0 /100 | #75 | Exceptional 85.4% |
| Iranians | 99.0 /100 | #76 | Exceptional 85.4% |
Demographics Similar to Bermudans by In Labor Force | Age 30-34
In terms of in labor force | age 30-34, the demographic groups most similar to Bermudans are Estonian (85.9%, a difference of 0.0%), Immigrants from Eritrea (85.9%, a difference of 0.010%), Bulgarian (86.0%, a difference of 0.020%), Immigrants from Bulgaria (86.0%, a difference of 0.020%), and Immigrants from North Macedonia (85.9%, a difference of 0.020%).
| Demographics | Rating | Rank | In Labor Force | Age 30-34 |
| Immigrants | Albania | 100.0 /100 | #15 | Exceptional 86.1% |
| Latvians | 100.0 /100 | #16 | Exceptional 86.0% |
| Immigrants | Cameroon | 100.0 /100 | #17 | Exceptional 86.0% |
| Immigrants | Sierra Leone | 100.0 /100 | #18 | Exceptional 86.0% |
| Sierra Leoneans | 100.0 /100 | #19 | Exceptional 86.0% |
| Bulgarians | 100.0 /100 | #20 | Exceptional 86.0% |
| Immigrants | Bulgaria | 100.0 /100 | #21 | Exceptional 86.0% |
| Bermudans | 100.0 /100 | #22 | Exceptional 85.9% |
| Estonians | 100.0 /100 | #23 | Exceptional 85.9% |
| Immigrants | Eritrea | 100.0 /100 | #24 | Exceptional 85.9% |
| Immigrants | North Macedonia | 100.0 /100 | #25 | Exceptional 85.9% |
| Immigrants | Eastern Africa | 100.0 /100 | #26 | Exceptional 85.9% |
| Immigrants | Liberia | 100.0 /100 | #27 | Exceptional 85.9% |
| Immigrants | Latvia | 100.0 /100 | #28 | Exceptional 85.9% |
| Tsimshian | 100.0 /100 | #29 | Exceptional 85.8% |