Immigrants from Iran vs Blackfeet In Labor Force | Age 30-34
COMPARE
Immigrants from Iran
Blackfeet
In Labor Force | Age 30-34
In Labor Force | Age 30-34 Comparison
Immigrants from Iran
Blackfeet
85.4%
IN LABOR FORCE | AGE 30-34
99.2/ 100
METRIC RATING
69th/ 347
METRIC RANK
82.8%
IN LABOR FORCE | AGE 30-34
0.0/ 100
METRIC RATING
290th/ 347
METRIC RANK
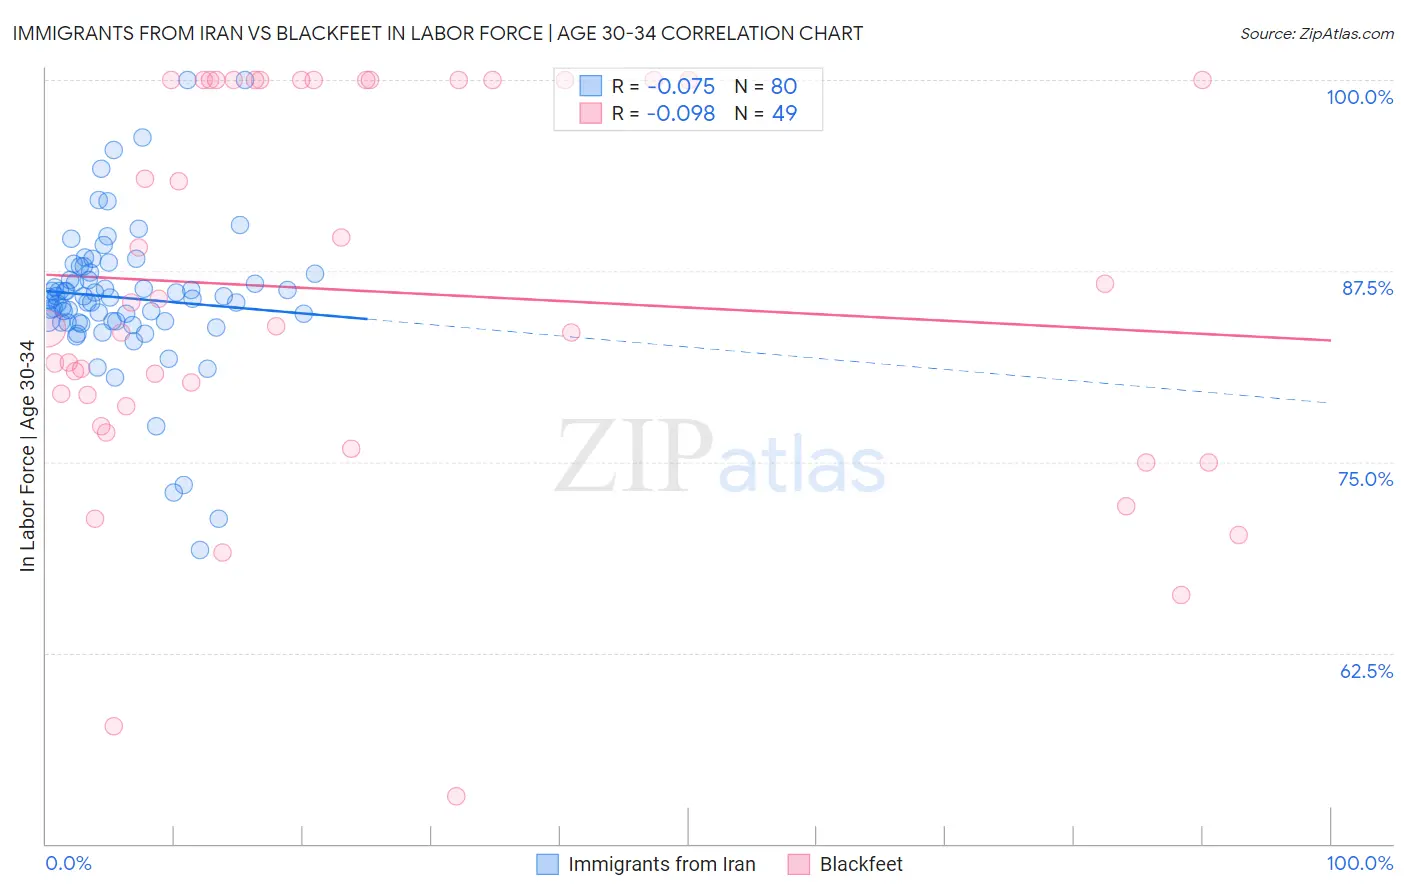
Immigrants from Iran vs Blackfeet In Labor Force | Age 30-34 Correlation Chart
The statistical analysis conducted on geographies consisting of 279,826,659 people shows a slight negative correlation between the proportion of Immigrants from Iran and labor force participation rate among population between the ages 30 and 34 in the United States with a correlation coefficient (R) of -0.075 and weighted average of 85.4%. Similarly, the statistical analysis conducted on geographies consisting of 309,450,197 people shows a slight negative correlation between the proportion of Blackfeet and labor force participation rate among population between the ages 30 and 34 in the United States with a correlation coefficient (R) of -0.098 and weighted average of 82.8%, a difference of 3.1%.
In Labor Force | Age 30-34 Correlation Summary
| Measurement | Immigrants from Iran | Blackfeet |
| Minimum | 69.2% | 53.1% |
| Maximum | 100.0% | 100.0% |
| Range | 30.8% | 46.9% |
| Mean | 85.7% | 86.2% |
| Median | 85.8% | 83.9% |
| Interquartile 25% (IQ1) | 84.2% | 78.0% |
| Interquartile 75% (IQ3) | 87.3% | 100.0% |
| Interquartile Range (IQR) | 3.2% | 22.0% |
| Standard Deviation (Sample) | 4.9% | 12.5% |
| Standard Deviation (Population) | 4.9% | 12.4% |
Similar Demographics by In Labor Force | Age 30-34
Demographics Similar to Immigrants from Iran by In Labor Force | Age 30-34
In terms of in labor force | age 30-34, the demographic groups most similar to Immigrants from Iran are Brazilian (85.4%, a difference of 0.020%), Immigrants from Eastern Europe (85.4%, a difference of 0.030%), Immigrants from Japan (85.4%, a difference of 0.030%), Immigrants from China (85.4%, a difference of 0.030%), and Indian (Asian) (85.4%, a difference of 0.030%).
| Demographics | Rating | Rank | In Labor Force | Age 30-34 |
| Soviet Union | 99.4 /100 | #62 | Exceptional 85.5% |
| Macedonians | 99.4 /100 | #63 | Exceptional 85.5% |
| Italians | 99.4 /100 | #64 | Exceptional 85.4% |
| Senegalese | 99.4 /100 | #65 | Exceptional 85.4% |
| Ghanaians | 99.4 /100 | #66 | Exceptional 85.4% |
| Kenyans | 99.3 /100 | #67 | Exceptional 85.4% |
| Immigrants | Eastern Europe | 99.3 /100 | #68 | Exceptional 85.4% |
| Immigrants | Iran | 99.2 /100 | #69 | Exceptional 85.4% |
| Brazilians | 99.1 /100 | #70 | Exceptional 85.4% |
| Immigrants | Japan | 99.1 /100 | #71 | Exceptional 85.4% |
| Immigrants | China | 99.0 /100 | #72 | Exceptional 85.4% |
| Indians (Asian) | 99.0 /100 | #73 | Exceptional 85.4% |
| Maltese | 99.0 /100 | #74 | Exceptional 85.4% |
| Immigrants | Czechoslovakia | 99.0 /100 | #75 | Exceptional 85.4% |
| Iranians | 99.0 /100 | #76 | Exceptional 85.4% |
Demographics Similar to Blackfeet by In Labor Force | Age 30-34
In terms of in labor force | age 30-34, the demographic groups most similar to Blackfeet are Potawatomi (82.8%, a difference of 0.020%), Black/African American (82.8%, a difference of 0.040%), Nepalese (82.7%, a difference of 0.11%), American (82.7%, a difference of 0.13%), and Hawaiian (83.0%, a difference of 0.23%).
| Demographics | Rating | Rank | In Labor Force | Age 30-34 |
| Assyrians/Chaldeans/Syriacs | 0.0 /100 | #283 | Tragic 83.2% |
| Immigrants | Belize | 0.0 /100 | #284 | Tragic 83.2% |
| Cree | 0.0 /100 | #285 | Tragic 83.2% |
| Immigrants | Latin America | 0.0 /100 | #286 | Tragic 83.1% |
| Native Hawaiians | 0.0 /100 | #287 | Tragic 83.0% |
| Central American Indians | 0.0 /100 | #288 | Tragic 83.0% |
| Hawaiians | 0.0 /100 | #289 | Tragic 83.0% |
| Blackfeet | 0.0 /100 | #290 | Tragic 82.8% |
| Potawatomi | 0.0 /100 | #291 | Tragic 82.8% |
| Blacks/African Americans | 0.0 /100 | #292 | Tragic 82.8% |
| Nepalese | 0.0 /100 | #293 | Tragic 82.7% |
| Americans | 0.0 /100 | #294 | Tragic 82.7% |
| Pennsylvania Germans | 0.0 /100 | #295 | Tragic 82.6% |
| Chippewa | 0.0 /100 | #296 | Tragic 82.6% |
| Comanche | 0.0 /100 | #297 | Tragic 82.6% |