Immigrants from Poland vs Immigrants from Chile In Labor Force | Age 30-34
COMPARE
Immigrants from Poland
Immigrants from Chile
In Labor Force | Age 30-34
In Labor Force | Age 30-34 Comparison
Immigrants from Poland
Immigrants from Chile
85.5%
IN LABOR FORCE | AGE 30-34
99.5/ 100
METRIC RATING
59th/ 347
METRIC RANK
85.0%
IN LABOR FORCE | AGE 30-34
89.2/ 100
METRIC RATING
134th/ 347
METRIC RANK
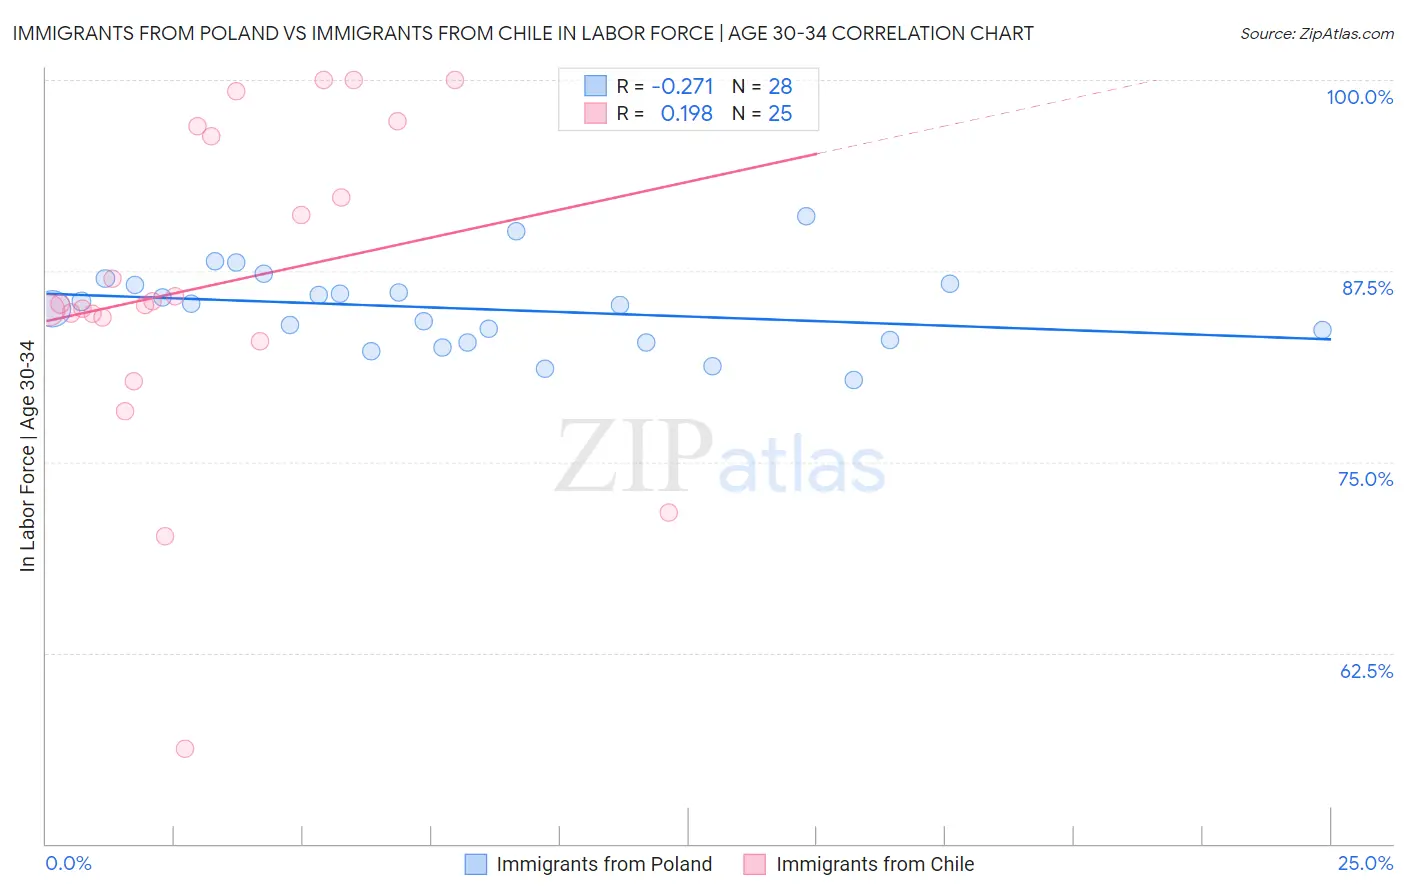
Immigrants from Poland vs Immigrants from Chile In Labor Force | Age 30-34 Correlation Chart
The statistical analysis conducted on geographies consisting of 304,756,662 people shows a weak negative correlation between the proportion of Immigrants from Poland and labor force participation rate among population between the ages 30 and 34 in the United States with a correlation coefficient (R) of -0.271 and weighted average of 85.5%. Similarly, the statistical analysis conducted on geographies consisting of 218,612,214 people shows a poor positive correlation between the proportion of Immigrants from Chile and labor force participation rate among population between the ages 30 and 34 in the United States with a correlation coefficient (R) of 0.198 and weighted average of 85.0%, a difference of 0.57%.
In Labor Force | Age 30-34 Correlation Summary
| Measurement | Immigrants from Poland | Immigrants from Chile |
| Minimum | 80.4% | 56.2% |
| Maximum | 91.1% | 100.0% |
| Range | 10.7% | 43.8% |
| Mean | 85.0% | 86.6% |
| Median | 85.3% | 85.3% |
| Interquartile 25% (IQ1) | 82.9% | 83.7% |
| Interquartile 75% (IQ3) | 86.6% | 96.6% |
| Interquartile Range (IQR) | 3.7% | 13.0% |
| Standard Deviation (Sample) | 2.6% | 10.5% |
| Standard Deviation (Population) | 2.6% | 10.3% |
Similar Demographics by In Labor Force | Age 30-34
Demographics Similar to Immigrants from Poland by In Labor Force | Age 30-34
In terms of in labor force | age 30-34, the demographic groups most similar to Immigrants from Poland are Polish (85.5%, a difference of 0.010%), Immigrants from Turkey (85.5%, a difference of 0.020%), Czech (85.5%, a difference of 0.020%), Russian (85.5%, a difference of 0.020%), and Immigrants from France (85.5%, a difference of 0.020%).
| Demographics | Rating | Rank | In Labor Force | Age 30-34 |
| Slovenes | 99.7 /100 | #52 | Exceptional 85.6% |
| Filipinos | 99.6 /100 | #53 | Exceptional 85.5% |
| Immigrants | Kenya | 99.6 /100 | #54 | Exceptional 85.5% |
| Immigrants | Turkey | 99.6 /100 | #55 | Exceptional 85.5% |
| Czechs | 99.6 /100 | #56 | Exceptional 85.5% |
| Russians | 99.6 /100 | #57 | Exceptional 85.5% |
| Poles | 99.6 /100 | #58 | Exceptional 85.5% |
| Immigrants | Poland | 99.5 /100 | #59 | Exceptional 85.5% |
| Immigrants | France | 99.5 /100 | #60 | Exceptional 85.5% |
| Immigrants | Brazil | 99.5 /100 | #61 | Exceptional 85.5% |
| Soviet Union | 99.4 /100 | #62 | Exceptional 85.5% |
| Macedonians | 99.4 /100 | #63 | Exceptional 85.5% |
| Italians | 99.4 /100 | #64 | Exceptional 85.4% |
| Senegalese | 99.4 /100 | #65 | Exceptional 85.4% |
| Ghanaians | 99.4 /100 | #66 | Exceptional 85.4% |
Demographics Similar to Immigrants from Chile by In Labor Force | Age 30-34
In terms of in labor force | age 30-34, the demographic groups most similar to Immigrants from Chile are Immigrants from Asia (85.0%, a difference of 0.0%), Chinese (85.0%, a difference of 0.010%), Immigrants from Israel (85.0%, a difference of 0.010%), New Zealander (85.0%, a difference of 0.010%), and Jordanian (85.0%, a difference of 0.010%).
| Demographics | Rating | Rank | In Labor Force | Age 30-34 |
| Slavs | 90.7 /100 | #127 | Exceptional 85.0% |
| Immigrants | Argentina | 90.6 /100 | #128 | Exceptional 85.0% |
| Immigrants | Western Africa | 90.2 /100 | #129 | Exceptional 85.0% |
| Immigrants | Spain | 90.0 /100 | #130 | Exceptional 85.0% |
| Chinese | 89.6 /100 | #131 | Excellent 85.0% |
| Immigrants | Israel | 89.5 /100 | #132 | Excellent 85.0% |
| New Zealanders | 89.5 /100 | #133 | Excellent 85.0% |
| Immigrants | Chile | 89.2 /100 | #134 | Excellent 85.0% |
| Immigrants | Asia | 88.9 /100 | #135 | Excellent 85.0% |
| Jordanians | 88.6 /100 | #136 | Excellent 85.0% |
| South Africans | 88.0 /100 | #137 | Excellent 85.0% |
| Sri Lankans | 87.8 /100 | #138 | Excellent 85.0% |
| Bhutanese | 87.5 /100 | #139 | Excellent 85.0% |
| Immigrants | Vietnam | 86.5 /100 | #140 | Excellent 85.0% |
| Chileans | 85.3 /100 | #141 | Excellent 84.9% |