Arapaho vs Chilean In Labor Force | Age 20-24
COMPARE
Arapaho
Chilean
In Labor Force | Age 20-24
In Labor Force | Age 20-24 Comparison
Arapaho
Chileans
73.8%
IN LABOR FORCE | AGE 20-24
1.0/ 100
METRIC RATING
253rd/ 347
METRIC RANK
74.5%
IN LABOR FORCE | AGE 20-24
12.5/ 100
METRIC RATING
217th/ 347
METRIC RANK
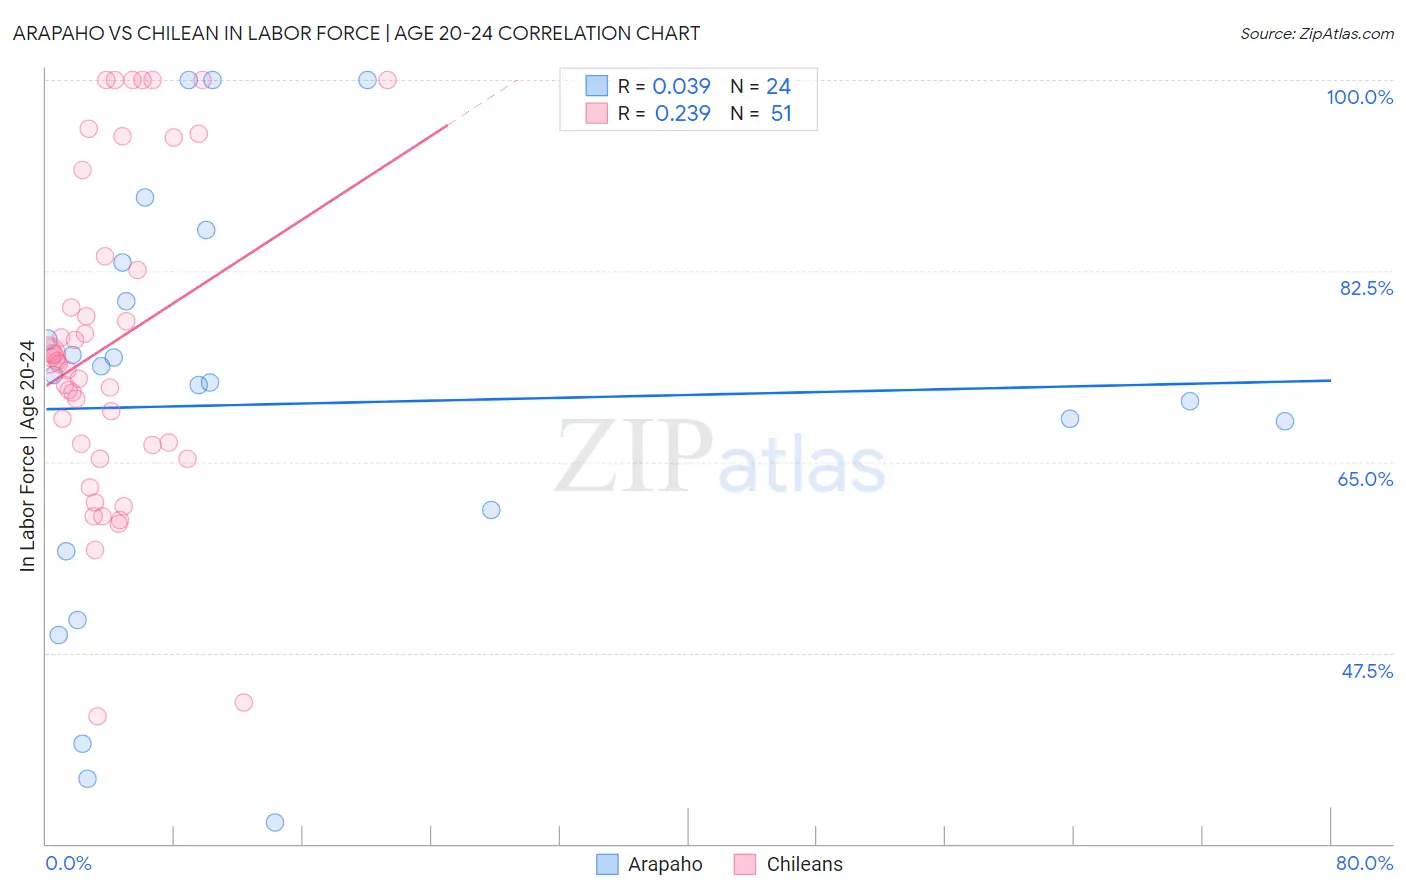
Arapaho vs Chilean In Labor Force | Age 20-24 Correlation Chart
The statistical analysis conducted on geographies consisting of 29,774,764 people shows no correlation between the proportion of Arapaho and labor force participation rate among population between the ages 20 and 24 in the United States with a correlation coefficient (R) of 0.039 and weighted average of 73.8%. Similarly, the statistical analysis conducted on geographies consisting of 256,670,531 people shows a weak positive correlation between the proportion of Chileans and labor force participation rate among population between the ages 20 and 24 in the United States with a correlation coefficient (R) of 0.239 and weighted average of 74.5%, a difference of 0.99%.
In Labor Force | Age 20-24 Correlation Summary
| Measurement | Arapaho | Chilean |
| Minimum | 32.0% | 41.7% |
| Maximum | 100.0% | 100.0% |
| Range | 68.0% | 58.3% |
| Mean | 70.3% | 75.8% |
| Median | 72.6% | 74.3% |
| Interquartile 25% (IQ1) | 58.7% | 66.6% |
| Interquartile 75% (IQ3) | 81.5% | 83.8% |
| Interquartile Range (IQR) | 22.8% | 17.3% |
| Standard Deviation (Sample) | 19.0% | 14.8% |
| Standard Deviation (Population) | 18.6% | 14.6% |
Similar Demographics by In Labor Force | Age 20-24
Demographics Similar to Arapaho by In Labor Force | Age 20-24
In terms of in labor force | age 20-24, the demographic groups most similar to Arapaho are Ute (73.8%, a difference of 0.0%), Immigrants from Pakistan (73.8%, a difference of 0.030%), Immigrants from Kazakhstan (73.8%, a difference of 0.040%), Immigrants from Egypt (73.8%, a difference of 0.070%), and Spanish American Indian (73.7%, a difference of 0.070%).
| Demographics | Rating | Rank | In Labor Force | Age 20-24 |
| Immigrants | Panama | 1.6 /100 | #246 | Tragic 73.9% |
| Colville | 1.5 /100 | #247 | Tragic 73.9% |
| Immigrants | Saudi Arabia | 1.5 /100 | #248 | Tragic 73.9% |
| Blacks/African Americans | 1.3 /100 | #249 | Tragic 73.9% |
| Immigrants | Belgium | 1.3 /100 | #250 | Tragic 73.9% |
| Immigrants | Egypt | 1.2 /100 | #251 | Tragic 73.8% |
| Immigrants | Kazakhstan | 1.1 /100 | #252 | Tragic 73.8% |
| Arapaho | 1.0 /100 | #253 | Tragic 73.8% |
| Ute | 1.0 /100 | #254 | Tragic 73.8% |
| Immigrants | Pakistan | 0.9 /100 | #255 | Tragic 73.8% |
| Spanish American Indians | 0.8 /100 | #256 | Tragic 73.7% |
| Paraguayans | 0.8 /100 | #257 | Tragic 73.7% |
| Egyptians | 0.7 /100 | #258 | Tragic 73.7% |
| Dutch West Indians | 0.7 /100 | #259 | Tragic 73.7% |
| Immigrants | Turkey | 0.7 /100 | #260 | Tragic 73.7% |
Demographics Similar to Chileans by In Labor Force | Age 20-24
In terms of in labor force | age 20-24, the demographic groups most similar to Chileans are Immigrants from Ghana (74.5%, a difference of 0.010%), Immigrants from Kuwait (74.5%, a difference of 0.010%), Immigrants from Southern Europe (74.5%, a difference of 0.020%), Creek (74.5%, a difference of 0.030%), and Peruvian (74.5%, a difference of 0.030%).
| Demographics | Rating | Rank | In Labor Force | Age 20-24 |
| Uruguayans | 15.1 /100 | #210 | Poor 74.6% |
| Immigrants | Australia | 14.7 /100 | #211 | Poor 74.6% |
| Creek | 13.3 /100 | #212 | Poor 74.5% |
| Peruvians | 13.3 /100 | #213 | Poor 74.5% |
| Immigrants | Southern Europe | 13.2 /100 | #214 | Poor 74.5% |
| Immigrants | Ghana | 12.7 /100 | #215 | Poor 74.5% |
| Immigrants | Kuwait | 12.7 /100 | #216 | Poor 74.5% |
| Chileans | 12.5 /100 | #217 | Poor 74.5% |
| Immigrants | Peru | 10.6 /100 | #218 | Poor 74.5% |
| Nepalese | 10.5 /100 | #219 | Poor 74.5% |
| Immigrants | Norway | 10.3 /100 | #220 | Poor 74.5% |
| Chickasaw | 10.3 /100 | #221 | Poor 74.5% |
| Immigrants | India | 9.9 /100 | #222 | Tragic 74.4% |
| Hispanics or Latinos | 7.9 /100 | #223 | Tragic 74.4% |
| Seminole | 6.9 /100 | #224 | Tragic 74.3% |