Immigrants from Hong Kong vs Comanche In Labor Force | Age 20-64
COMPARE
Immigrants from Hong Kong
Comanche
In Labor Force | Age 20-64
In Labor Force | Age 20-64 Comparison
Immigrants from Hong Kong
Comanche
80.4%
IN LABOR FORCE | AGE 20-64
99.5/ 100
METRIC RATING
48th/ 347
METRIC RANK
77.0%
IN LABOR FORCE | AGE 20-64
0.0/ 100
METRIC RATING
310th/ 347
METRIC RANK
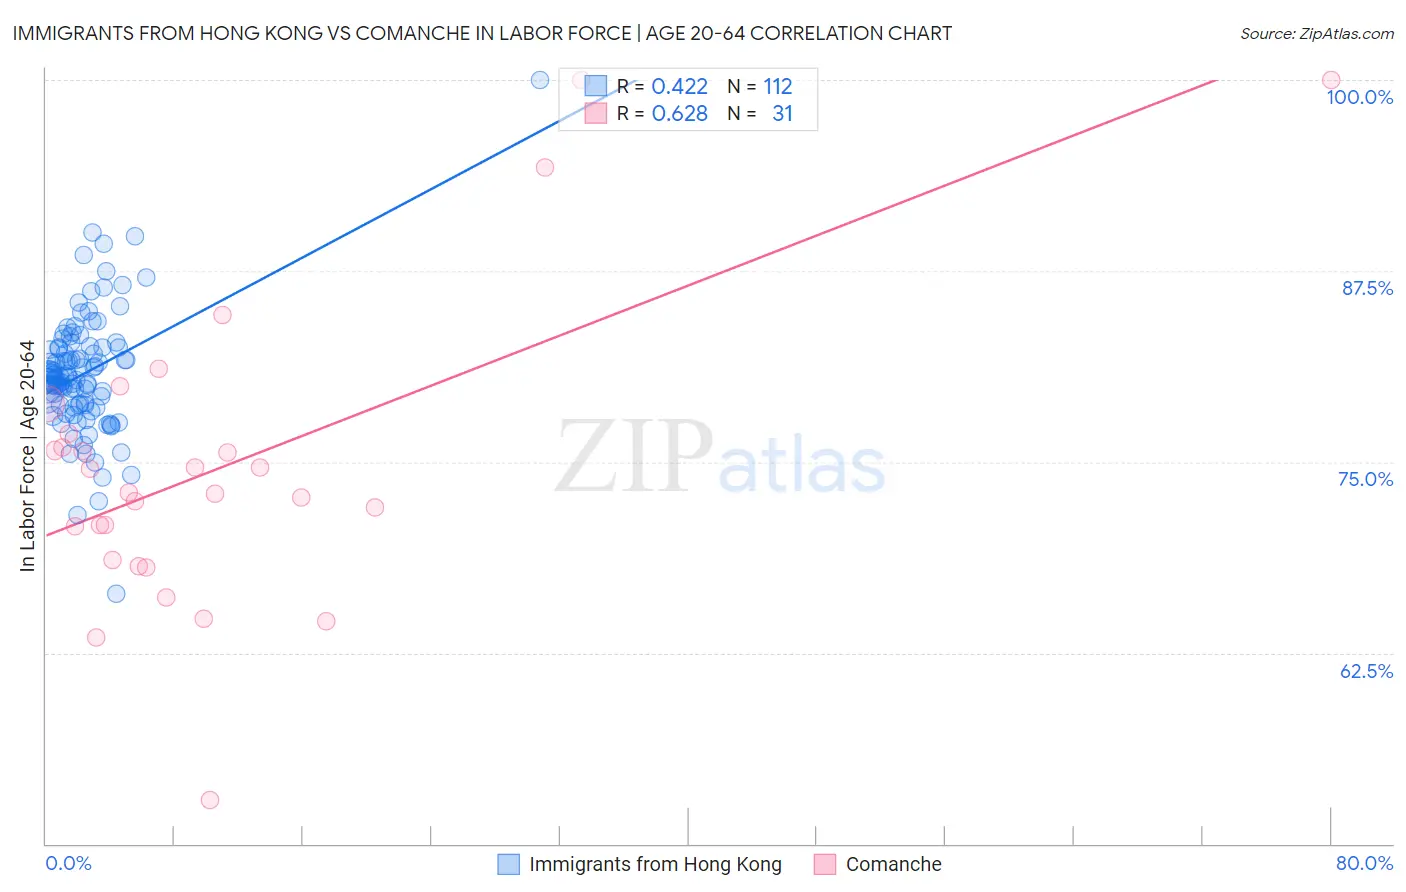
Immigrants from Hong Kong vs Comanche In Labor Force | Age 20-64 Correlation Chart
The statistical analysis conducted on geographies consisting of 254,003,180 people shows a moderate positive correlation between the proportion of Immigrants from Hong Kong and labor force participation rate among population between the ages 20 and 64 in the United States with a correlation coefficient (R) of 0.422 and weighted average of 80.4%. Similarly, the statistical analysis conducted on geographies consisting of 109,783,732 people shows a significant positive correlation between the proportion of Comanche and labor force participation rate among population between the ages 20 and 64 in the United States with a correlation coefficient (R) of 0.628 and weighted average of 77.0%, a difference of 4.4%.
In Labor Force | Age 20-64 Correlation Summary
| Measurement | Immigrants from Hong Kong | Comanche |
| Minimum | 66.4% | 52.9% |
| Maximum | 100.0% | 100.0% |
| Range | 33.6% | 47.1% |
| Mean | 80.8% | 74.7% |
| Median | 80.6% | 73.0% |
| Interquartile 25% (IQ1) | 78.7% | 68.6% |
| Interquartile 75% (IQ3) | 82.5% | 76.8% |
| Interquartile Range (IQR) | 3.7% | 8.3% |
| Standard Deviation (Sample) | 4.1% | 9.9% |
| Standard Deviation (Population) | 4.0% | 9.7% |
Similar Demographics by In Labor Force | Age 20-64
Demographics Similar to Immigrants from Hong Kong by In Labor Force | Age 20-64
In terms of in labor force | age 20-64, the demographic groups most similar to Immigrants from Hong Kong are Immigrants from Africa (80.4%, a difference of 0.020%), Immigrants from Greece (80.4%, a difference of 0.040%), Immigrants from Sudan (80.4%, a difference of 0.050%), Slovene (80.5%, a difference of 0.060%), and Immigrants from Pakistan (80.5%, a difference of 0.060%).
| Demographics | Rating | Rank | In Labor Force | Age 20-64 |
| Immigrants | Liberia | 99.8 /100 | #41 | Exceptional 80.5% |
| Latvians | 99.8 /100 | #42 | Exceptional 80.5% |
| Czechs | 99.7 /100 | #43 | Exceptional 80.5% |
| Immigrants | Middle Africa | 99.7 /100 | #44 | Exceptional 80.5% |
| Slovenes | 99.7 /100 | #45 | Exceptional 80.5% |
| Immigrants | Pakistan | 99.6 /100 | #46 | Exceptional 80.5% |
| Immigrants | Africa | 99.6 /100 | #47 | Exceptional 80.4% |
| Immigrants | Hong Kong | 99.5 /100 | #48 | Exceptional 80.4% |
| Immigrants | Greece | 99.4 /100 | #49 | Exceptional 80.4% |
| Immigrants | Sudan | 99.4 /100 | #50 | Exceptional 80.4% |
| Immigrants | Sri Lanka | 99.3 /100 | #51 | Exceptional 80.4% |
| Turks | 99.2 /100 | #52 | Exceptional 80.3% |
| Immigrants | Peru | 99.2 /100 | #53 | Exceptional 80.3% |
| Peruvians | 99.1 /100 | #54 | Exceptional 80.3% |
| Immigrants | Cabo Verde | 99.0 /100 | #55 | Exceptional 80.3% |
Demographics Similar to Comanche by In Labor Force | Age 20-64
In terms of in labor force | age 20-64, the demographic groups most similar to Comanche are Alaska Native (77.0%, a difference of 0.020%), American (77.0%, a difference of 0.020%), Blackfeet (77.0%, a difference of 0.030%), Central American Indian (77.1%, a difference of 0.080%), and Alaskan Athabascan (76.9%, a difference of 0.21%).
| Demographics | Rating | Rank | In Labor Force | Age 20-64 |
| Chippewa | 0.0 /100 | #303 | Tragic 77.3% |
| Immigrants | Mexico | 0.0 /100 | #304 | Tragic 77.3% |
| Mexicans | 0.0 /100 | #305 | Tragic 77.2% |
| Potawatomi | 0.0 /100 | #306 | Tragic 77.2% |
| Central American Indians | 0.0 /100 | #307 | Tragic 77.1% |
| Alaska Natives | 0.0 /100 | #308 | Tragic 77.0% |
| Americans | 0.0 /100 | #309 | Tragic 77.0% |
| Comanche | 0.0 /100 | #310 | Tragic 77.0% |
| Blackfeet | 0.0 /100 | #311 | Tragic 77.0% |
| Alaskan Athabascans | 0.0 /100 | #312 | Tragic 76.9% |
| Shoshone | 0.0 /100 | #313 | Tragic 76.8% |
| Blacks/African Americans | 0.0 /100 | #314 | Tragic 76.8% |
| Ottawa | 0.0 /100 | #315 | Tragic 76.7% |
| Yaqui | 0.0 /100 | #316 | Tragic 76.5% |
| Cherokee | 0.0 /100 | #317 | Tragic 76.2% |