Slovene vs Comanche In Labor Force | Age 20-64

COMPARE

Slovene
Race
Ancestry
AfghanAfricanAlaska NativeAlaskan AthabascanAlbanianAleutAlsatianAmericanApacheArabArapahoArgentineanArmenianAssyrian/Chaldean/SyriacAustralianAustrianBahamianBangladeshiBarbadianBasqueBelgianBelizeanBermudanBhutaneseBlackfeetBolivianBrazilianBritishBritish West IndianBulgarianBurmeseCajunCambodianCanadianCape VerdeanCarpatho RusynCelticCentral AmericanCentral American IndianCherokeeCheyenneChickasawChileanChineseChippewaChoctawColombianColvilleCosta RicanCreeCreekCroatianCrowCubanCypriotCzechCzechoslovakianDanishDelawareDominicanDutchDutch West IndianEastern EuropeanEcuadorianEgyptianEnglishEstonianEthiopianEuropeanFijianFilipinoFinnishFrenchFrench American IndianFrench CanadianGermanGerman RussianGhanaianGreekGuamanian/ChamorroGuatemalanGuyaneseHaitianHmongHonduranHopiHoumaHungarianIcelanderIndian (Asian)IndonesianInupiatIranianIraqiIrishIroquoisIsraeliItalianJamaicanJapaneseJordanianKenyanKiowaKoreanLaotianLatvianLebaneseLiberianLithuanianLumbeeLuxembourgerMacedonianMalaysianMalteseMarshalleseMenomineeMexicanMexican American IndianMongolianMoroccanNative HawaiianNavajoNepaleseNew ZealanderNicaraguanNigerianNorthern EuropeanNorwegianOkinawanOsageOttawaPaiutePakistaniPalestinianPanamanianParaguayanPennsylvania GermanPeruvianPimaPolishPortuguesePotawatomiPuebloPuerto RicanPuget Sound SalishRomanianRussianSalvadoranSamoanScandinavianScotch-IrishScottishSeminoleSenegaleseSerbianShoshoneSierra LeoneanSiouxSlavicSlovakSloveneSomaliSouth AfricanSouth AmericanSouth American IndianSoviet UnionSpaniardSpanishSpanish AmericanSpanish American IndianSri LankanSubsaharan AfricanSudaneseSwedishSwissSyrianTaiwaneseThaiTlingit-HaidaTohono O'OdhamTonganTrinidadian and TobagonianTsimshianTurkishU.S. Virgin IslanderUgandanUkrainianUruguayanUteVenezuelanVietnameseWelshWest IndianYakamaYaquiYugoslavianYumanYup'ikZimbabwean
Immigration
NonimmigrantsImmigrantsAfghanistanAfricaAlbaniaArgentinaArmeniaAsiaAustraliaAustriaBahamasBangladeshBarbadosBelarusBelgiumBelizeBoliviaBosnia and HerzegovinaBrazilBulgariaBurma/MyanmarCabo VerdeCambodiaCameroonCanadaCaribbeanCentral AmericaChileChinaColombiaCongoCosta RicaCroatiaCubaCzechoslovakiaDenmarkDominicaDominican RepublicEastern AfricaEastern AsiaEastern EuropeEcuadorEgyptEl SalvadorEnglandEritreaEthiopiaEuropeFijiFranceGermanyGhanaGreeceGrenadaGuatemalaGuyanaHaitiHondurasHong KongHungaryIndiaIndonesiaIranIraqIrelandIsraelItalyJamaicaJapanJordanKazakhstanKenyaKoreaKuwaitLaosLatin AmericaLatviaLebanonLiberiaLithuaniaMalaysiaMexicoMicronesiaMiddle AfricaMoldovaMoroccoNepalNetherlandsNicaraguaNigeriaNorth AmericaNorth MacedoniaNorthern AfricaNorthern EuropeNorwayOceaniaPakistanPanamaPeruPhilippinesPolandPortugalRomaniaRussiaSaudi ArabiaScotlandSenegalSerbiaSierra LeoneSingaporeSomaliaSouth AfricaSouth AmericaSouth Central AsiaSouth Eastern AsiaSouthern EuropeSpainSri LankaSt. Vincent and the GrenadinesSudanSwedenSwitzerlandSyriaTaiwanThailandTrinidad and TobagoTurkeyUgandaUkraineUruguayUzbekistanVenezuelaVietnamWest IndiesWestern AfricaWestern AsiaWestern EuropeYemenZaireZimbabweAzores
Comanche
Race
Ancestry
AfghanAfricanAlaska NativeAlaskan AthabascanAlbanianAleutAlsatianAmericanApacheArabArapahoArgentineanArmenianAssyrian/Chaldean/SyriacAustralianAustrianBahamianBangladeshiBarbadianBasqueBelgianBelizeanBermudanBhutaneseBlackfeetBolivianBrazilianBritishBritish West IndianBulgarianBurmeseCajunCambodianCanadianCape VerdeanCarpatho RusynCelticCentral AmericanCentral American IndianCherokeeCheyenneChickasawChileanChineseChippewaChoctawColombianColvilleComancheCosta RicanCreeCreekCroatianCrowCubanCypriotCzechCzechoslovakianDanishDelawareDominicanDutchDutch West IndianEastern EuropeanEcuadorianEgyptianEnglishEstonianEthiopianEuropeanFijianFilipinoFinnishFrenchFrench American IndianFrench CanadianGermanGerman RussianGhanaianGreekGuamanian/ChamorroGuatemalanGuyaneseHaitianHmongHonduranHopiHoumaHungarianIcelanderIndian (Asian)IndonesianInupiatIranianIraqiIrishIroquoisIsraeliItalianJamaicanJapaneseJordanianKenyanKiowaKoreanLaotianLatvianLebaneseLiberianLithuanianLumbeeLuxembourgerMacedonianMalaysianMalteseMarshalleseMenomineeMexicanMexican American IndianMongolianMoroccanNative HawaiianNavajoNepaleseNew ZealanderNicaraguanNigerianNorthern EuropeanNorwegianOkinawanOsageOttawaPaiutePakistaniPalestinianPanamanianParaguayanPennsylvania GermanPeruvianPimaPolishPortuguesePotawatomiPuebloPuerto RicanPuget Sound SalishRomanianRussianSalvadoranSamoanScandinavianScotch-IrishScottishSeminoleSenegaleseSerbianShoshoneSierra LeoneanSiouxSlavicSlovakSomaliSouth AfricanSouth AmericanSouth American IndianSoviet UnionSpaniardSpanishSpanish AmericanSpanish American IndianSri LankanSubsaharan AfricanSudaneseSwedishSwissSyrianTaiwaneseThaiTlingit-HaidaTohono O'OdhamTonganTrinidadian and TobagonianTsimshianTurkishU.S. Virgin IslanderUgandanUkrainianUruguayanUteVenezuelanVietnameseWelshWest IndianYakamaYaquiYugoslavianYumanYup'ikZimbabwean
Immigration
NonimmigrantsImmigrantsAfghanistanAfricaAlbaniaArgentinaArmeniaAsiaAustraliaAustriaBahamasBangladeshBarbadosBelarusBelgiumBelizeBoliviaBosnia and HerzegovinaBrazilBulgariaBurma/MyanmarCabo VerdeCambodiaCameroonCanadaCaribbeanCentral AmericaChileChinaColombiaCongoCosta RicaCroatiaCubaCzechoslovakiaDenmarkDominicaDominican RepublicEastern AfricaEastern AsiaEastern EuropeEcuadorEgyptEl SalvadorEnglandEritreaEthiopiaEuropeFijiFranceGermanyGhanaGreeceGrenadaGuatemalaGuyanaHaitiHondurasHong KongHungaryIndiaIndonesiaIranIraqIrelandIsraelItalyJamaicaJapanJordanKazakhstanKenyaKoreaKuwaitLaosLatin AmericaLatviaLebanonLiberiaLithuaniaMalaysiaMexicoMicronesiaMiddle AfricaMoldovaMoroccoNepalNetherlandsNicaraguaNigeriaNorth AmericaNorth MacedoniaNorthern AfricaNorthern EuropeNorwayOceaniaPakistanPanamaPeruPhilippinesPolandPortugalRomaniaRussiaSaudi ArabiaScotlandSenegalSerbiaSierra LeoneSingaporeSomaliaSouth AfricaSouth AmericaSouth Central AsiaSouth Eastern AsiaSouthern EuropeSpainSri LankaSt. Vincent and the GrenadinesSudanSwedenSwitzerlandSyriaTaiwanThailandTrinidad and TobagoTurkeyUgandaUkraineUruguayUzbekistanVenezuelaVietnamWest IndiesWestern AfricaWestern AsiaWestern EuropeYemenZaireZimbabweAzores
In Labor Force | Age 20-64
Income
Poverty
Unemployment
Labor Participation
Family Structure
Vehicle Availability
Education Level
Disability

In Labor Force | Age 20-64 Comparison

Slovenes

Comanche

Exceptional
Tragic
80.5%
IN LABOR FORCE | AGE 20-64
99.7/ 100
METRIC RATING
45th/ 347
METRIC RANK
77.0%
IN LABOR FORCE | AGE 20-64
0.0/ 100
METRIC RATING
310th/ 347
METRIC RANK

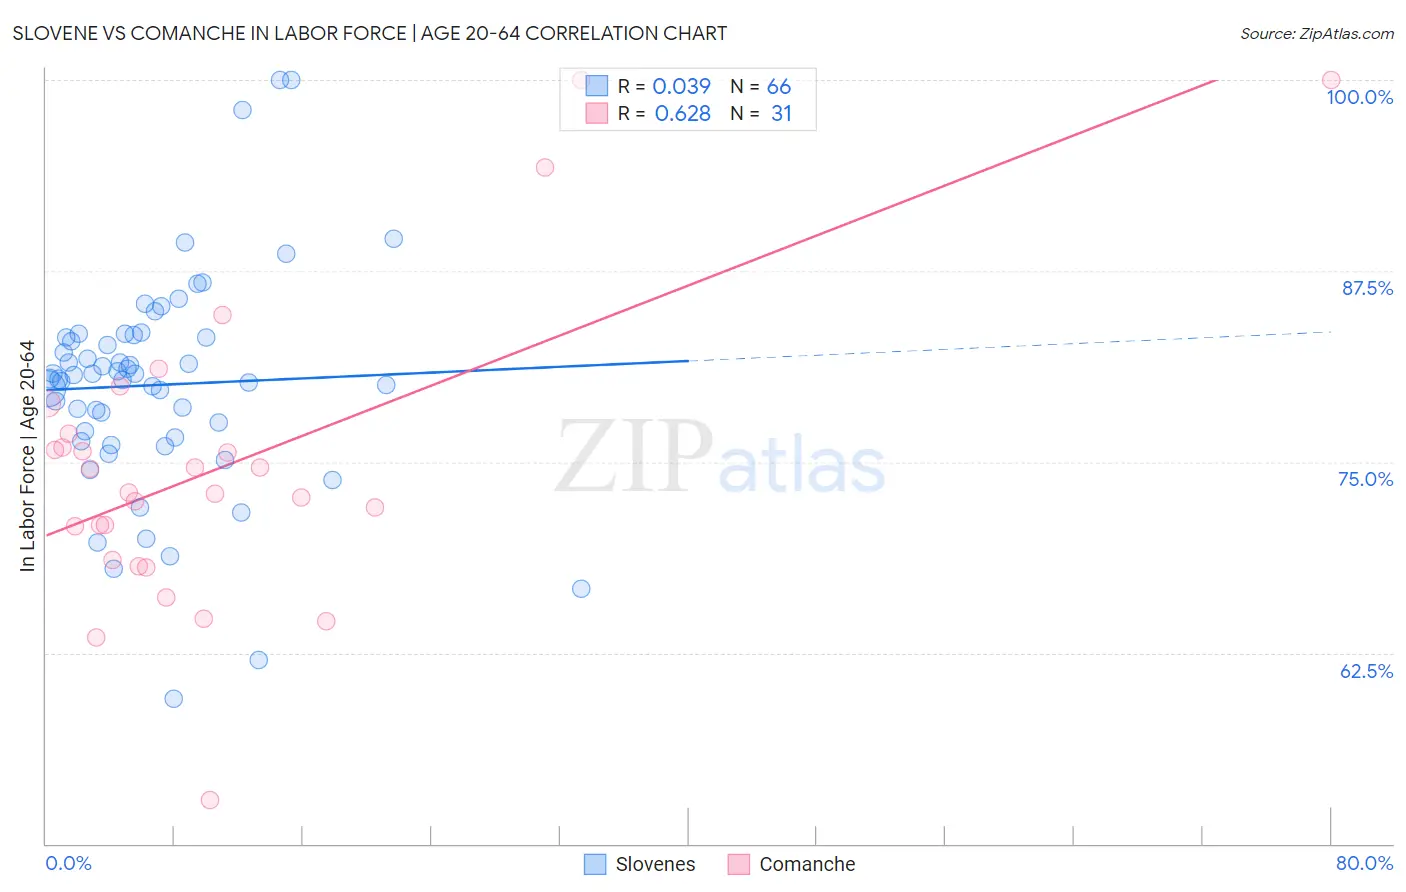
Slovene vs Comanche In Labor Force | Age 20-64 Correlation Chart

The statistical analysis conducted on geographies consisting of 261,356,284 people shows no correlation between the proportion of Slovenes and labor force participation rate among population between the ages 20 and 64 in the United States with a correlation coefficient (R) of 0.039 and weighted average of 80.5%. Similarly, the statistical analysis conducted on geographies consisting of 109,783,732 people shows a significant positive correlation between the proportion of Comanche and labor force participation rate among population between the ages 20 and 64 in the United States with a correlation coefficient (R) of 0.628 and weighted average of 77.0%, a difference of 4.5%.
Slovene vs Comanche In Labor Force | Age 20-64

In Labor Force | Age 20-64 Correlation Summary

MeasurementSloveneComanche
Minimum59.5%52.9%
Maximum100.0%100.0%
Range40.5%47.1%
Mean80.0%74.7%
Median80.6%73.0%
Interquartile 25% (IQ1)76.6%68.6%
Interquartile 75% (IQ3)83.1%76.8%
Interquartile Range (IQR)6.5%8.3%
Standard Deviation (Sample)7.2%9.9%
Standard Deviation (Population)7.2%9.7%

Similar Demographics by In Labor Force | Age 20-64

Demographics Similar to Slovenes by In Labor Force | Age 20-64

In terms of in labor force | age 20-64, the demographic groups most similar to Slovenes are Immigrants from Pakistan (80.5%, a difference of 0.010%), Immigrants from Middle Africa (80.5%, a difference of 0.020%), Immigrants from Africa (80.4%, a difference of 0.040%), Czech (80.5%, a difference of 0.060%), and Immigrants from Hong Kong (80.4%, a difference of 0.060%).
DemographicsRating | RankIn Labor Force | Age 20-64
Ugandans
99.8
/100
|
#38
Exceptional
80.6%
Brazilians
99.8
/100
|
#39
Exceptional
80.5%
Immigrants | Zimbabwe
99.8
/100
|
#40
Exceptional
80.5%
Immigrants | Liberia
99.8
/100
|
#41
Exceptional
80.5%
Latvians
99.8
/100
|
#42
Exceptional
80.5%
Czechs
99.7
/100
|
#43
Exceptional
80.5%
Immigrants | Middle Africa
99.7
/100
|
#44
Exceptional
80.5%
Slovenes
99.7
/100
|
#45
Exceptional
80.5%
Immigrants | Pakistan
99.6
/100
|
#46
Exceptional
80.5%
Immigrants | Africa
99.6
/100
|
#47
Exceptional
80.4%
Immigrants | Hong Kong
99.5
/100
|
#48
Exceptional
80.4%
Immigrants | Greece
99.4
/100
|
#49
Exceptional
80.4%
Immigrants | Sudan
99.4
/100
|
#50
Exceptional
80.4%
Immigrants | Sri Lanka
99.3
/100
|
#51
Exceptional
80.4%
Turks
99.2
/100
|
#52
Exceptional
80.3%

Demographics Similar to Comanche by In Labor Force | Age 20-64

In terms of in labor force | age 20-64, the demographic groups most similar to Comanche are Alaska Native (77.0%, a difference of 0.020%), American (77.0%, a difference of 0.020%), Blackfeet (77.0%, a difference of 0.030%), Central American Indian (77.1%, a difference of 0.080%), and Alaskan Athabascan (76.9%, a difference of 0.21%).
DemographicsRating | RankIn Labor Force | Age 20-64
Chippewa
0.0
/100
|
#303
Tragic
77.3%
Immigrants | Mexico
0.0
/100
|
#304
Tragic
77.3%
Mexicans
0.0
/100
|
#305
Tragic
77.2%
Potawatomi
0.0
/100
|
#306
Tragic
77.2%
Central American Indians
0.0
/100
|
#307
Tragic
77.1%
Alaska Natives
0.0
/100
|
#308
Tragic
77.0%
Americans
0.0
/100
|
#309
Tragic
77.0%
Comanche
0.0
/100
|
#310
Tragic
77.0%
Blackfeet
0.0
/100
|
#311
Tragic
77.0%
Alaskan Athabascans
0.0
/100
|
#312
Tragic
76.9%
Shoshone
0.0
/100
|
#313
Tragic
76.8%
Blacks/African Americans
0.0
/100
|
#314
Tragic
76.8%
Ottawa
0.0
/100
|
#315
Tragic
76.7%
Yaqui
0.0
/100
|
#316
Tragic
76.5%
Cherokee
0.0
/100
|
#317
Tragic
76.2%