Immigrants from Hong Kong vs Immigrants from South America In Labor Force | Age 20-64
COMPARE
Immigrants from Hong Kong
Immigrants from South America
In Labor Force | Age 20-64
In Labor Force | Age 20-64 Comparison
Immigrants from Hong Kong
Immigrants from South America
80.4%
IN LABOR FORCE | AGE 20-64
99.5/ 100
METRIC RATING
48th/ 347
METRIC RANK
80.0%
IN LABOR FORCE | AGE 20-64
93.9/ 100
METRIC RATING
111th/ 347
METRIC RANK
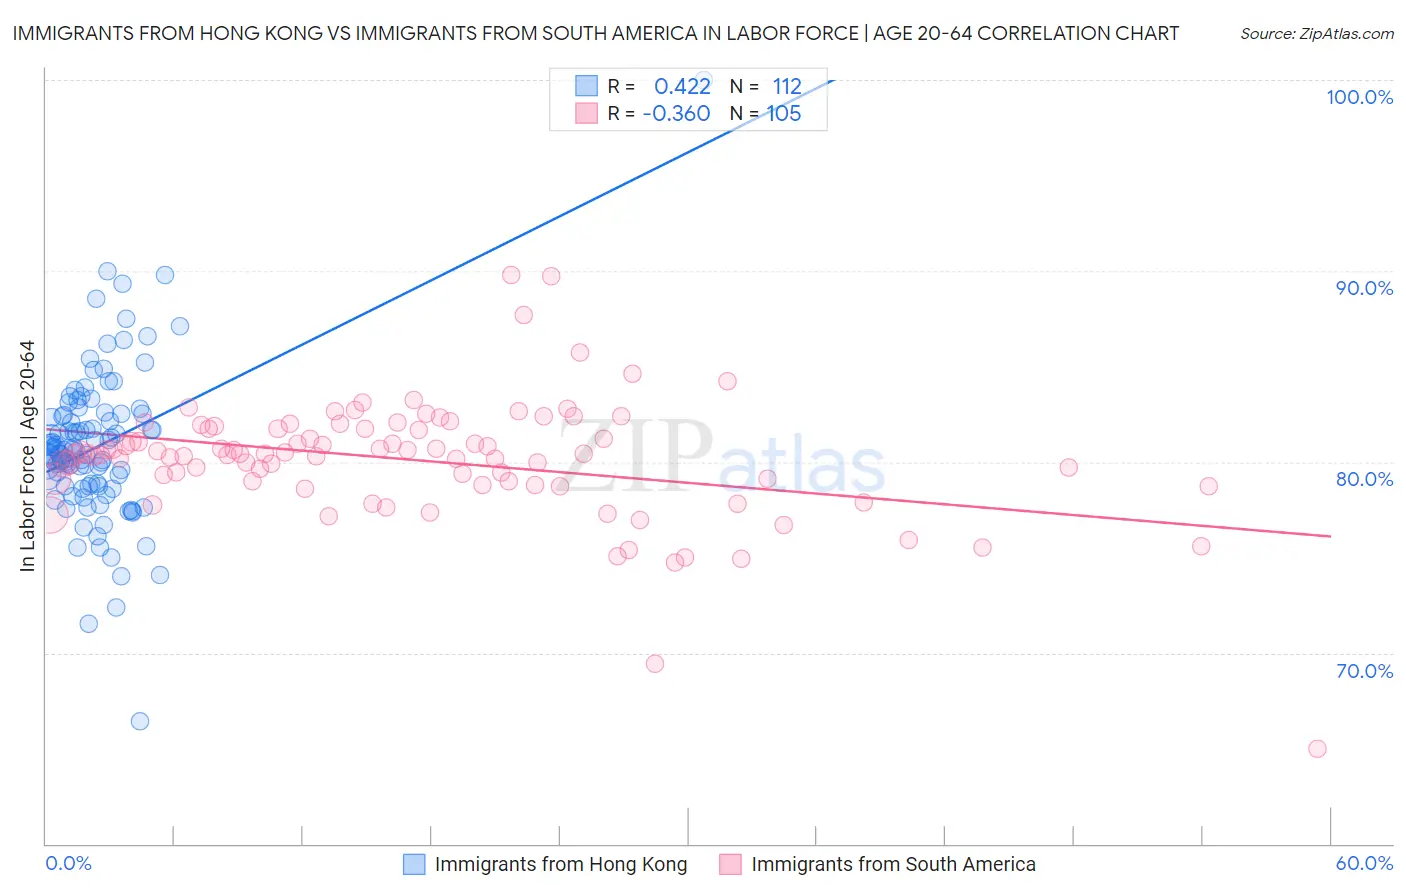
Immigrants from Hong Kong vs Immigrants from South America In Labor Force | Age 20-64 Correlation Chart
The statistical analysis conducted on geographies consisting of 254,003,180 people shows a moderate positive correlation between the proportion of Immigrants from Hong Kong and labor force participation rate among population between the ages 20 and 64 in the United States with a correlation coefficient (R) of 0.422 and weighted average of 80.4%. Similarly, the statistical analysis conducted on geographies consisting of 486,405,398 people shows a mild negative correlation between the proportion of Immigrants from South America and labor force participation rate among population between the ages 20 and 64 in the United States with a correlation coefficient (R) of -0.360 and weighted average of 80.0%, a difference of 0.52%.
In Labor Force | Age 20-64 Correlation Summary
| Measurement | Immigrants from Hong Kong | Immigrants from South America |
| Minimum | 66.4% | 65.0% |
| Maximum | 100.0% | 89.8% |
| Range | 33.6% | 24.8% |
| Mean | 80.8% | 80.1% |
| Median | 80.6% | 80.4% |
| Interquartile 25% (IQ1) | 78.7% | 78.9% |
| Interquartile 75% (IQ3) | 82.5% | 81.7% |
| Interquartile Range (IQR) | 3.7% | 2.9% |
| Standard Deviation (Sample) | 4.1% | 3.2% |
| Standard Deviation (Population) | 4.0% | 3.2% |
Similar Demographics by In Labor Force | Age 20-64
Demographics Similar to Immigrants from Hong Kong by In Labor Force | Age 20-64
In terms of in labor force | age 20-64, the demographic groups most similar to Immigrants from Hong Kong are Immigrants from Africa (80.4%, a difference of 0.020%), Immigrants from Greece (80.4%, a difference of 0.040%), Immigrants from Sudan (80.4%, a difference of 0.050%), Slovene (80.5%, a difference of 0.060%), and Immigrants from Pakistan (80.5%, a difference of 0.060%).
| Demographics | Rating | Rank | In Labor Force | Age 20-64 |
| Immigrants | Liberia | 99.8 /100 | #41 | Exceptional 80.5% |
| Latvians | 99.8 /100 | #42 | Exceptional 80.5% |
| Czechs | 99.7 /100 | #43 | Exceptional 80.5% |
| Immigrants | Middle Africa | 99.7 /100 | #44 | Exceptional 80.5% |
| Slovenes | 99.7 /100 | #45 | Exceptional 80.5% |
| Immigrants | Pakistan | 99.6 /100 | #46 | Exceptional 80.5% |
| Immigrants | Africa | 99.6 /100 | #47 | Exceptional 80.4% |
| Immigrants | Hong Kong | 99.5 /100 | #48 | Exceptional 80.4% |
| Immigrants | Greece | 99.4 /100 | #49 | Exceptional 80.4% |
| Immigrants | Sudan | 99.4 /100 | #50 | Exceptional 80.4% |
| Immigrants | Sri Lanka | 99.3 /100 | #51 | Exceptional 80.4% |
| Turks | 99.2 /100 | #52 | Exceptional 80.3% |
| Immigrants | Peru | 99.2 /100 | #53 | Exceptional 80.3% |
| Peruvians | 99.1 /100 | #54 | Exceptional 80.3% |
| Immigrants | Cabo Verde | 99.0 /100 | #55 | Exceptional 80.3% |
Demographics Similar to Immigrants from South America by In Labor Force | Age 20-64
In terms of in labor force | age 20-64, the demographic groups most similar to Immigrants from South America are Estonian (80.0%, a difference of 0.0%), Immigrants from Italy (80.0%, a difference of 0.0%), Sri Lankan (80.0%, a difference of 0.0%), Iranian (80.0%, a difference of 0.010%), and Immigrants from Argentina (80.0%, a difference of 0.010%).
| Demographics | Rating | Rank | In Labor Force | Age 20-64 |
| Venezuelans | 95.3 /100 | #104 | Exceptional 80.0% |
| Immigrants | Ghana | 95.0 /100 | #105 | Exceptional 80.0% |
| Greeks | 94.8 /100 | #106 | Exceptional 80.0% |
| Immigrants | Jordan | 94.8 /100 | #107 | Exceptional 80.0% |
| Iranians | 94.3 /100 | #108 | Exceptional 80.0% |
| Immigrants | Argentina | 94.1 /100 | #109 | Exceptional 80.0% |
| Estonians | 94.0 /100 | #110 | Exceptional 80.0% |
| Immigrants | South America | 93.9 /100 | #111 | Exceptional 80.0% |
| Immigrants | Italy | 93.9 /100 | #112 | Exceptional 80.0% |
| Sri Lankans | 93.9 /100 | #113 | Exceptional 80.0% |
| Argentineans | 93.8 /100 | #114 | Exceptional 80.0% |
| Bermudans | 93.3 /100 | #115 | Exceptional 80.0% |
| Immigrants | Western Africa | 93.1 /100 | #116 | Exceptional 80.0% |
| Immigrants | Vietnam | 92.7 /100 | #117 | Exceptional 80.0% |
| Cape Verdeans | 92.7 /100 | #118 | Exceptional 80.0% |