Immigrants from Hong Kong vs Comanche Cognitive Disability
COMPARE
Immigrants from Hong Kong
Comanche
Cognitive Disability
Cognitive Disability Comparison
Immigrants from Hong Kong
Comanche
16.0%
COGNITIVE DISABILITY
100.0/ 100
METRIC RATING
5th/ 347
METRIC RANK
18.6%
COGNITIVE DISABILITY
0.0/ 100
METRIC RATING
319th/ 347
METRIC RANK
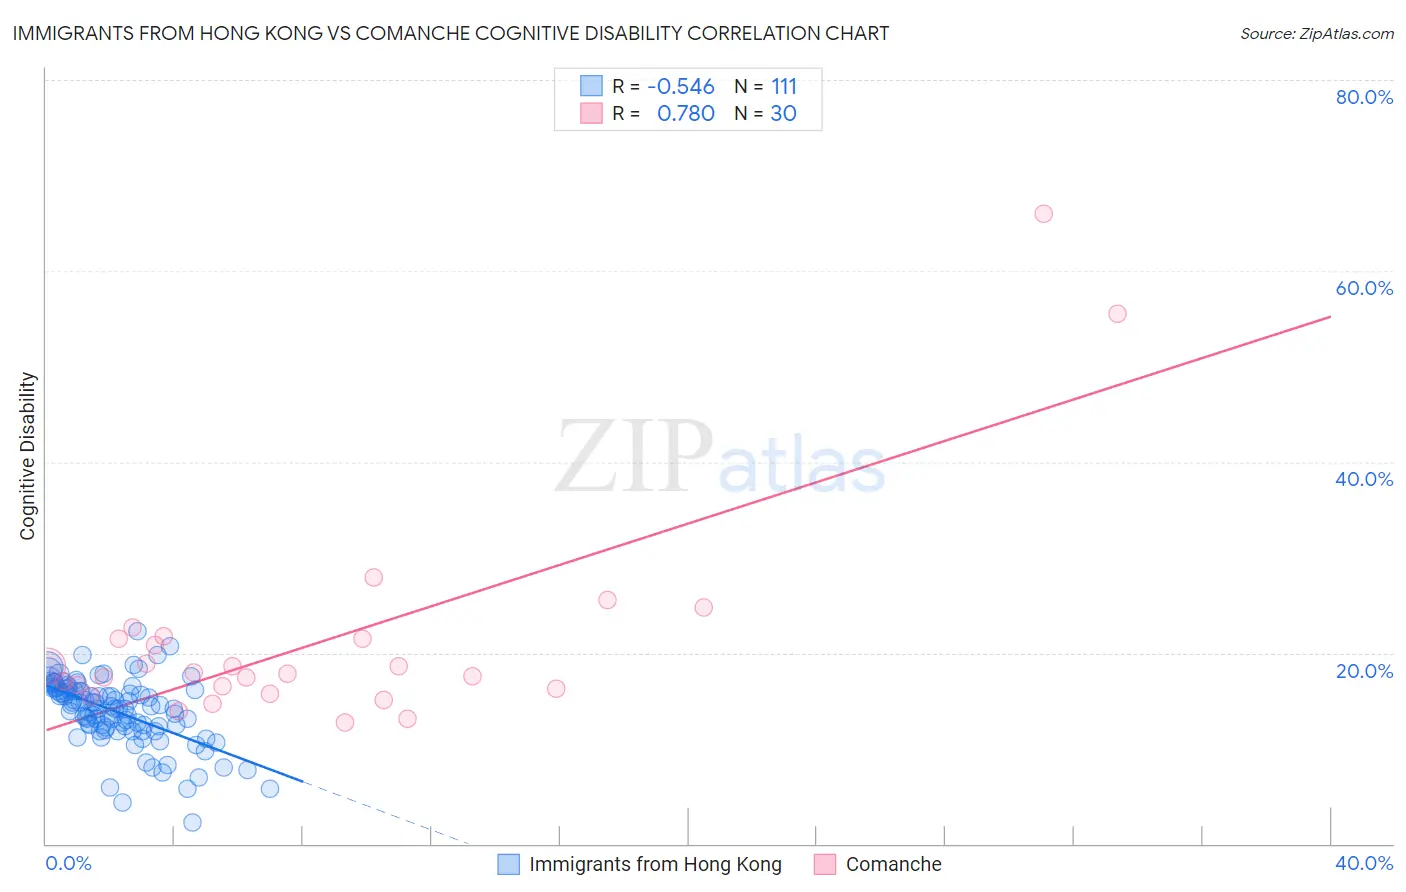
Immigrants from Hong Kong vs Comanche Cognitive Disability Correlation Chart
The statistical analysis conducted on geographies consisting of 253,985,578 people shows a substantial negative correlation between the proportion of Immigrants from Hong Kong and percentage of population with cognitive disability in the United States with a correlation coefficient (R) of -0.546 and weighted average of 16.0%. Similarly, the statistical analysis conducted on geographies consisting of 109,776,806 people shows a strong positive correlation between the proportion of Comanche and percentage of population with cognitive disability in the United States with a correlation coefficient (R) of 0.780 and weighted average of 18.6%, a difference of 16.2%.
Cognitive Disability Correlation Summary
| Measurement | Immigrants from Hong Kong | Comanche |
| Minimum | 2.3% | 12.7% |
| Maximum | 22.3% | 66.0% |
| Range | 20.0% | 53.3% |
| Mean | 13.8% | 21.3% |
| Median | 14.4% | 17.9% |
| Interquartile 25% (IQ1) | 12.2% | 16.2% |
| Interquartile 75% (IQ3) | 16.1% | 21.5% |
| Interquartile Range (IQR) | 3.9% | 5.3% |
| Standard Deviation (Sample) | 3.5% | 11.4% |
| Standard Deviation (Population) | 3.5% | 11.2% |
Similar Demographics by Cognitive Disability
Demographics Similar to Immigrants from Hong Kong by Cognitive Disability
In terms of cognitive disability, the demographic groups most similar to Immigrants from Hong Kong are Immigrants from Lithuania (16.0%, a difference of 0.41%), Chinese (15.9%, a difference of 0.59%), Thai (16.1%, a difference of 0.61%), Immigrants from India (15.9%, a difference of 0.68%), and Immigrants from Ireland (16.1%, a difference of 0.72%).
| Demographics | Rating | Rank | Cognitive Disability |
| Immigrants | Taiwan | 100.0 /100 | #1 | Exceptional 15.7% |
| Immigrants | India | 100.0 /100 | #2 | Exceptional 15.9% |
| Chinese | 100.0 /100 | #3 | Exceptional 15.9% |
| Immigrants | Lithuania | 100.0 /100 | #4 | Exceptional 16.0% |
| Immigrants | Hong Kong | 100.0 /100 | #5 | Exceptional 16.0% |
| Thais | 100.0 /100 | #6 | Exceptional 16.1% |
| Immigrants | Ireland | 100.0 /100 | #7 | Exceptional 16.1% |
| Immigrants | Poland | 100.0 /100 | #8 | Exceptional 16.1% |
| Assyrians/Chaldeans/Syriacs | 100.0 /100 | #9 | Exceptional 16.2% |
| Immigrants | Scotland | 100.0 /100 | #10 | Exceptional 16.2% |
| Immigrants | Czechoslovakia | 100.0 /100 | #11 | Exceptional 16.2% |
| Maltese | 100.0 /100 | #12 | Exceptional 16.2% |
| Lithuanians | 100.0 /100 | #13 | Exceptional 16.3% |
| Immigrants | Austria | 100.0 /100 | #14 | Exceptional 16.3% |
| Immigrants | Greece | 100.0 /100 | #15 | Exceptional 16.3% |
Demographics Similar to Comanche by Cognitive Disability
In terms of cognitive disability, the demographic groups most similar to Comanche are Bangladeshi (18.6%, a difference of 0.040%), Apache (18.6%, a difference of 0.040%), African (18.6%, a difference of 0.13%), Liberian (18.6%, a difference of 0.16%), and Immigrants from Liberia (18.7%, a difference of 0.19%).
| Demographics | Rating | Rank | Cognitive Disability |
| Chickasaw | 0.0 /100 | #312 | Tragic 18.5% |
| Yaqui | 0.0 /100 | #313 | Tragic 18.5% |
| Sub-Saharan Africans | 0.0 /100 | #314 | Tragic 18.5% |
| Immigrants | Dominica | 0.0 /100 | #315 | Tragic 18.6% |
| Immigrants | Middle Africa | 0.0 /100 | #316 | Tragic 18.6% |
| Liberians | 0.0 /100 | #317 | Tragic 18.6% |
| Bangladeshis | 0.0 /100 | #318 | Tragic 18.6% |
| Comanche | 0.0 /100 | #319 | Tragic 18.6% |
| Apache | 0.0 /100 | #320 | Tragic 18.6% |
| Africans | 0.0 /100 | #321 | Tragic 18.6% |
| Immigrants | Liberia | 0.0 /100 | #322 | Tragic 18.7% |
| Pueblo | 0.0 /100 | #323 | Tragic 18.7% |
| Dominicans | 0.0 /100 | #324 | Tragic 18.7% |
| Indonesians | 0.0 /100 | #325 | Tragic 18.7% |
| Immigrants | Senegal | 0.0 /100 | #326 | Tragic 18.7% |