Alaska Native vs Apache In Labor Force | Age 25-29
COMPARE
Alaska Native
Apache
In Labor Force | Age 25-29
In Labor Force | Age 25-29 Comparison
Alaska Natives
Apache
81.6%
IN LABOR FORCE | AGE 25-29
0.0/ 100
METRIC RATING
323rd/ 347
METRIC RANK
79.2%
IN LABOR FORCE | AGE 25-29
0.0/ 100
METRIC RATING
336th/ 347
METRIC RANK
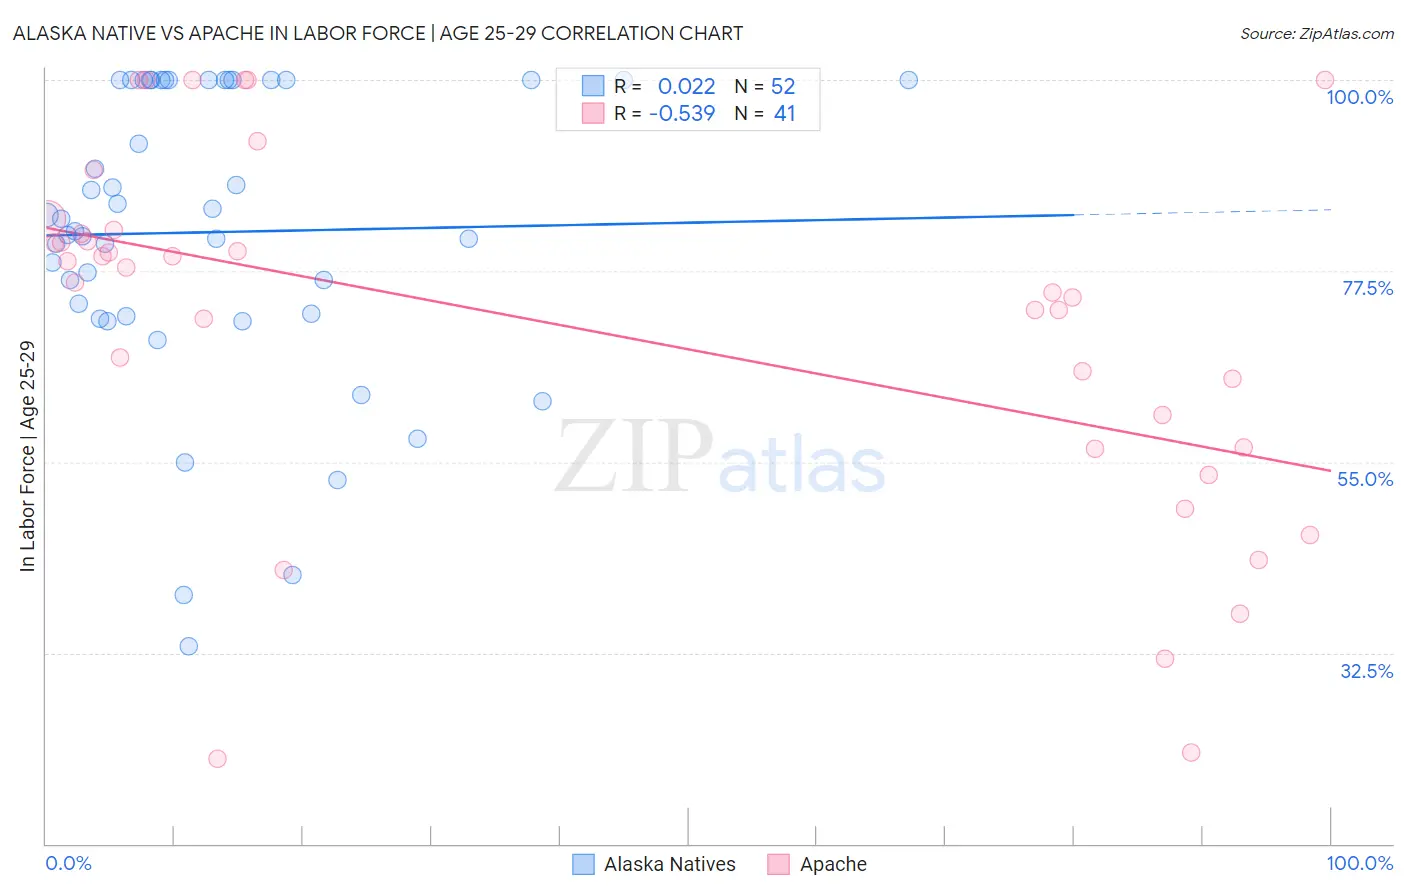
Alaska Native vs Apache In Labor Force | Age 25-29 Correlation Chart
The statistical analysis conducted on geographies consisting of 76,769,069 people shows no correlation between the proportion of Alaska Natives and labor force participation rate among population between the ages 25 and 29 in the United States with a correlation coefficient (R) of 0.022 and weighted average of 81.6%. Similarly, the statistical analysis conducted on geographies consisting of 231,063,738 people shows a substantial negative correlation between the proportion of Apache and labor force participation rate among population between the ages 25 and 29 in the United States with a correlation coefficient (R) of -0.539 and weighted average of 79.2%, a difference of 3.0%.
In Labor Force | Age 25-29 Correlation Summary
| Measurement | Alaska Native | Apache |
| Minimum | 33.3% | 20.0% |
| Maximum | 100.0% | 100.0% |
| Range | 66.7% | 80.0% |
| Mean | 82.1% | 70.9% |
| Median | 82.8% | 76.2% |
| Interquartile 25% (IQ1) | 72.3% | 56.6% |
| Interquartile 75% (IQ3) | 100.0% | 82.1% |
| Interquartile Range (IQR) | 27.7% | 25.5% |
| Standard Deviation (Sample) | 17.4% | 21.4% |
| Standard Deviation (Population) | 17.2% | 21.2% |
Demographics Similar to Alaska Natives and Apache by In Labor Force | Age 25-29
In terms of in labor force | age 25-29, the demographic groups most similar to Alaska Natives are Kiowa (81.6%, a difference of 0.050%), Shoshone (81.6%, a difference of 0.060%), Colville (81.6%, a difference of 0.11%), Seminole (81.7%, a difference of 0.16%), and Houma (81.2%, a difference of 0.41%). Similarly, the demographic groups most similar to Apache are Native/Alaskan (79.3%, a difference of 0.070%), Yuman (79.3%, a difference of 0.16%), Sioux (79.7%, a difference of 0.57%), Inupiat (79.8%, a difference of 0.68%), and Crow (78.6%, a difference of 0.76%).
| Demographics | Rating | Rank | In Labor Force | Age 25-29 |
| Seminole | 0.0 /100 | #319 | Tragic 81.7% |
| Colville | 0.0 /100 | #320 | Tragic 81.6% |
| Shoshone | 0.0 /100 | #321 | Tragic 81.6% |
| Kiowa | 0.0 /100 | #322 | Tragic 81.6% |
| Alaska Natives | 0.0 /100 | #323 | Tragic 81.6% |
| Houma | 0.0 /100 | #324 | Tragic 81.2% |
| Dutch West Indians | 0.0 /100 | #325 | Tragic 81.1% |
| Choctaw | 0.0 /100 | #326 | Tragic 81.0% |
| Ute | 0.0 /100 | #327 | Tragic 80.8% |
| Creek | 0.0 /100 | #328 | Tragic 80.7% |
| Yakama | 0.0 /100 | #329 | Tragic 80.6% |
| Puerto Ricans | 0.0 /100 | #330 | Tragic 80.4% |
| Cheyenne | 0.0 /100 | #331 | Tragic 80.3% |
| Inupiat | 0.0 /100 | #332 | Tragic 79.8% |
| Sioux | 0.0 /100 | #333 | Tragic 79.7% |
| Yuman | 0.0 /100 | #334 | Tragic 79.3% |
| Natives/Alaskans | 0.0 /100 | #335 | Tragic 79.3% |
| Apache | 0.0 /100 | #336 | Tragic 79.2% |
| Crow | 0.0 /100 | #337 | Tragic 78.6% |
| Lumbee | 0.0 /100 | #338 | Tragic 78.3% |
| Immigrants | Yemen | 0.0 /100 | #339 | Tragic 78.2% |