Immigrants from Grenada vs Apache In Labor Force | Age 25-29
COMPARE
Immigrants from Grenada
Apache
In Labor Force | Age 25-29
In Labor Force | Age 25-29 Comparison
Immigrants from Grenada
Apache
82.8%
IN LABOR FORCE | AGE 25-29
0.0/ 100
METRIC RATING
303rd/ 347
METRIC RANK
79.2%
IN LABOR FORCE | AGE 25-29
0.0/ 100
METRIC RATING
336th/ 347
METRIC RANK
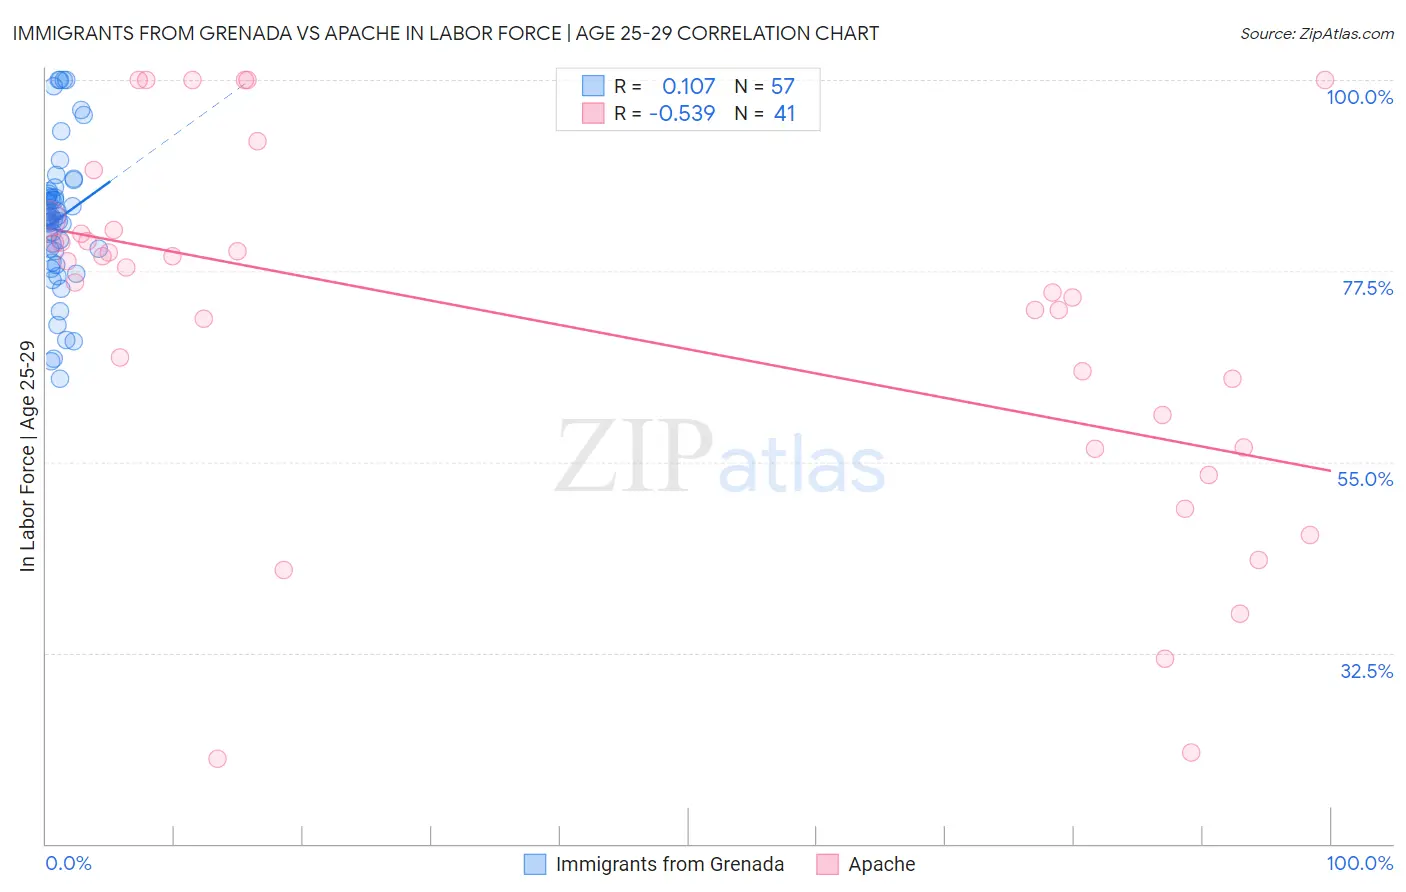
Immigrants from Grenada vs Apache In Labor Force | Age 25-29 Correlation Chart
The statistical analysis conducted on geographies consisting of 67,199,109 people shows a poor positive correlation between the proportion of Immigrants from Grenada and labor force participation rate among population between the ages 25 and 29 in the United States with a correlation coefficient (R) of 0.107 and weighted average of 82.8%. Similarly, the statistical analysis conducted on geographies consisting of 231,063,738 people shows a substantial negative correlation between the proportion of Apache and labor force participation rate among population between the ages 25 and 29 in the United States with a correlation coefficient (R) of -0.539 and weighted average of 79.2%, a difference of 4.5%.
In Labor Force | Age 25-29 Correlation Summary
| Measurement | Immigrants from Grenada | Apache |
| Minimum | 64.8% | 20.0% |
| Maximum | 100.0% | 100.0% |
| Range | 35.2% | 80.0% |
| Mean | 83.6% | 70.9% |
| Median | 84.0% | 76.2% |
| Interquartile 25% (IQ1) | 79.2% | 56.6% |
| Interquartile 75% (IQ3) | 86.7% | 82.1% |
| Interquartile Range (IQR) | 7.6% | 25.5% |
| Standard Deviation (Sample) | 8.3% | 21.4% |
| Standard Deviation (Population) | 8.3% | 21.2% |
Similar Demographics by In Labor Force | Age 25-29
Demographics Similar to Immigrants from Grenada by In Labor Force | Age 25-29
In terms of in labor force | age 25-29, the demographic groups most similar to Immigrants from Grenada are Immigrants from Belize (82.8%, a difference of 0.010%), Vietnamese (82.8%, a difference of 0.050%), Spanish American Indian (82.9%, a difference of 0.11%), Fijian (82.9%, a difference of 0.12%), and Immigrants from St. Vincent and the Grenadines (82.7%, a difference of 0.12%).
| Demographics | Rating | Rank | In Labor Force | Age 25-29 |
| Immigrants | Nicaragua | 0.0 /100 | #296 | Tragic 82.9% |
| Potawatomi | 0.0 /100 | #297 | Tragic 82.9% |
| Native Hawaiians | 0.0 /100 | #298 | Tragic 82.9% |
| Fijians | 0.0 /100 | #299 | Tragic 82.9% |
| Spanish American Indians | 0.0 /100 | #300 | Tragic 82.9% |
| Vietnamese | 0.0 /100 | #301 | Tragic 82.8% |
| Immigrants | Belize | 0.0 /100 | #302 | Tragic 82.8% |
| Immigrants | Grenada | 0.0 /100 | #303 | Tragic 82.8% |
| Immigrants | St. Vincent and the Grenadines | 0.0 /100 | #304 | Tragic 82.7% |
| Blacks/African Americans | 0.0 /100 | #305 | Tragic 82.6% |
| Blackfeet | 0.0 /100 | #306 | Tragic 82.6% |
| Cajuns | 0.0 /100 | #307 | Tragic 82.5% |
| Central American Indians | 0.0 /100 | #308 | Tragic 82.4% |
| Immigrants | Central America | 0.0 /100 | #309 | Tragic 82.4% |
| Osage | 0.0 /100 | #310 | Tragic 82.3% |
Demographics Similar to Apache by In Labor Force | Age 25-29
In terms of in labor force | age 25-29, the demographic groups most similar to Apache are Native/Alaskan (79.3%, a difference of 0.070%), Yuman (79.3%, a difference of 0.16%), Sioux (79.7%, a difference of 0.57%), Inupiat (79.8%, a difference of 0.68%), and Crow (78.6%, a difference of 0.76%).
| Demographics | Rating | Rank | In Labor Force | Age 25-29 |
| Yakama | 0.0 /100 | #329 | Tragic 80.6% |
| Puerto Ricans | 0.0 /100 | #330 | Tragic 80.4% |
| Cheyenne | 0.0 /100 | #331 | Tragic 80.3% |
| Inupiat | 0.0 /100 | #332 | Tragic 79.8% |
| Sioux | 0.0 /100 | #333 | Tragic 79.7% |
| Yuman | 0.0 /100 | #334 | Tragic 79.3% |
| Natives/Alaskans | 0.0 /100 | #335 | Tragic 79.3% |
| Apache | 0.0 /100 | #336 | Tragic 79.2% |
| Crow | 0.0 /100 | #337 | Tragic 78.6% |
| Lumbee | 0.0 /100 | #338 | Tragic 78.3% |
| Immigrants | Yemen | 0.0 /100 | #339 | Tragic 78.2% |
| Paiute | 0.0 /100 | #340 | Tragic 78.1% |
| Tohono O'odham | 0.0 /100 | #341 | Tragic 77.5% |
| Pueblo | 0.0 /100 | #342 | Tragic 77.5% |
| Arapaho | 0.0 /100 | #343 | Tragic 76.6% |