Immigrants from Hong Kong vs Iraqi In Labor Force | Age 25-29
COMPARE
Immigrants from Hong Kong
Iraqi
In Labor Force | Age 25-29
In Labor Force | Age 25-29 Comparison
Immigrants from Hong Kong
Iraqis
85.0%
IN LABOR FORCE | AGE 25-29
92.8/ 100
METRIC RATING
105th/ 347
METRIC RANK
83.9%
IN LABOR FORCE | AGE 25-29
0.9/ 100
METRIC RATING
235th/ 347
METRIC RANK
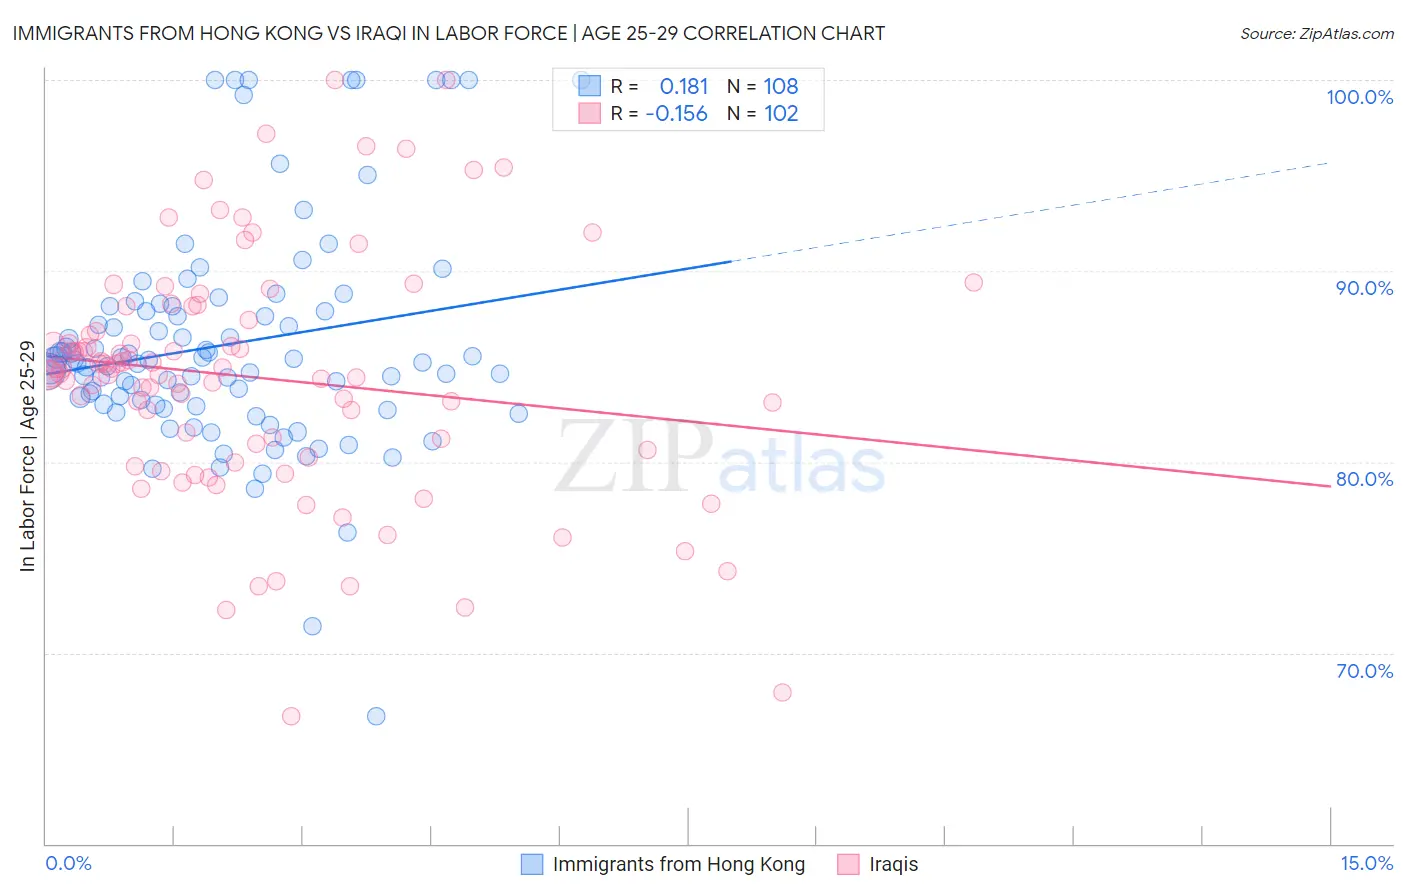
Immigrants from Hong Kong vs Iraqi In Labor Force | Age 25-29 Correlation Chart
The statistical analysis conducted on geographies consisting of 253,942,072 people shows a poor positive correlation between the proportion of Immigrants from Hong Kong and labor force participation rate among population between the ages 25 and 29 in the United States with a correlation coefficient (R) of 0.181 and weighted average of 85.0%. Similarly, the statistical analysis conducted on geographies consisting of 170,636,038 people shows a poor negative correlation between the proportion of Iraqis and labor force participation rate among population between the ages 25 and 29 in the United States with a correlation coefficient (R) of -0.156 and weighted average of 83.9%, a difference of 1.3%.
In Labor Force | Age 25-29 Correlation Summary
| Measurement | Immigrants from Hong Kong | Iraqi |
| Minimum | 66.7% | 66.7% |
| Maximum | 100.0% | 100.0% |
| Range | 33.3% | 33.3% |
| Mean | 86.1% | 84.4% |
| Median | 85.3% | 84.8% |
| Interquartile 25% (IQ1) | 83.0% | 80.6% |
| Interquartile 75% (IQ3) | 88.0% | 87.5% |
| Interquartile Range (IQR) | 5.0% | 6.9% |
| Standard Deviation (Sample) | 5.9% | 6.3% |
| Standard Deviation (Population) | 5.9% | 6.3% |
Similar Demographics by In Labor Force | Age 25-29
Demographics Similar to Immigrants from Hong Kong by In Labor Force | Age 25-29
In terms of in labor force | age 25-29, the demographic groups most similar to Immigrants from Hong Kong are Czechoslovakian (85.0%, a difference of 0.0%), Immigrants from Zaire (85.1%, a difference of 0.010%), Immigrants from Southern Europe (85.0%, a difference of 0.010%), Immigrants from Japan (85.1%, a difference of 0.020%), and Immigrants from Austria (85.0%, a difference of 0.020%).
| Demographics | Rating | Rank | In Labor Force | Age 25-29 |
| Mongolians | 94.1 /100 | #98 | Exceptional 85.1% |
| Bangladeshis | 94.0 /100 | #99 | Exceptional 85.1% |
| Immigrants | Switzerland | 93.9 /100 | #100 | Exceptional 85.1% |
| Egyptians | 93.8 /100 | #101 | Exceptional 85.1% |
| Slavs | 93.7 /100 | #102 | Exceptional 85.1% |
| Immigrants | Japan | 93.5 /100 | #103 | Exceptional 85.1% |
| Immigrants | Zaire | 93.3 /100 | #104 | Exceptional 85.1% |
| Immigrants | Hong Kong | 92.8 /100 | #105 | Exceptional 85.0% |
| Czechoslovakians | 92.6 /100 | #106 | Exceptional 85.0% |
| Immigrants | Southern Europe | 92.3 /100 | #107 | Exceptional 85.0% |
| Immigrants | Austria | 91.9 /100 | #108 | Exceptional 85.0% |
| Costa Ricans | 91.9 /100 | #109 | Exceptional 85.0% |
| New Zealanders | 91.5 /100 | #110 | Exceptional 85.0% |
| Immigrants | Middle Africa | 91.4 /100 | #111 | Exceptional 85.0% |
| Senegalese | 90.9 /100 | #112 | Exceptional 85.0% |
Demographics Similar to Iraqis by In Labor Force | Age 25-29
In terms of in labor force | age 25-29, the demographic groups most similar to Iraqis are Guamanian/Chamorro (83.9%, a difference of 0.0%), Immigrants (83.9%, a difference of 0.010%), Barbadian (83.9%, a difference of 0.020%), Immigrants from Uzbekistan (83.9%, a difference of 0.030%), and Jamaican (83.9%, a difference of 0.040%).
| Demographics | Rating | Rank | In Labor Force | Age 25-29 |
| Immigrants | Panama | 5.5 /100 | #228 | Tragic 84.2% |
| Immigrants | Oceania | 5.0 /100 | #229 | Tragic 84.2% |
| Whites/Caucasians | 4.8 /100 | #230 | Tragic 84.2% |
| Immigrants | Philippines | 4.7 /100 | #231 | Tragic 84.2% |
| Panamanians | 4.5 /100 | #232 | Tragic 84.2% |
| Immigrants | Western Asia | 2.7 /100 | #233 | Tragic 84.1% |
| Barbadians | 1.0 /100 | #234 | Tragic 83.9% |
| Iraqis | 0.9 /100 | #235 | Tragic 83.9% |
| Guamanians/Chamorros | 0.9 /100 | #236 | Tragic 83.9% |
| Immigrants | Immigrants | 0.9 /100 | #237 | Tragic 83.9% |
| Immigrants | Uzbekistan | 0.8 /100 | #238 | Tragic 83.9% |
| Jamaicans | 0.8 /100 | #239 | Tragic 83.9% |
| Trinidadians and Tobagonians | 0.7 /100 | #240 | Tragic 83.9% |
| Alsatians | 0.7 /100 | #241 | Tragic 83.9% |
| U.S. Virgin Islanders | 0.6 /100 | #242 | Tragic 83.8% |