Immigrants from Honduras vs New Zealander In Labor Force | Age 16-19
COMPARE
Immigrants from Honduras
New Zealander
In Labor Force | Age 16-19
In Labor Force | Age 16-19 Comparison
Immigrants from Honduras
New Zealanders
35.2%
IN LABOR FORCE | AGE 16-19
4.9/ 100
METRIC RATING
230th/ 347
METRIC RANK
38.0%
IN LABOR FORCE | AGE 16-19
95.6/ 100
METRIC RATING
128th/ 347
METRIC RANK
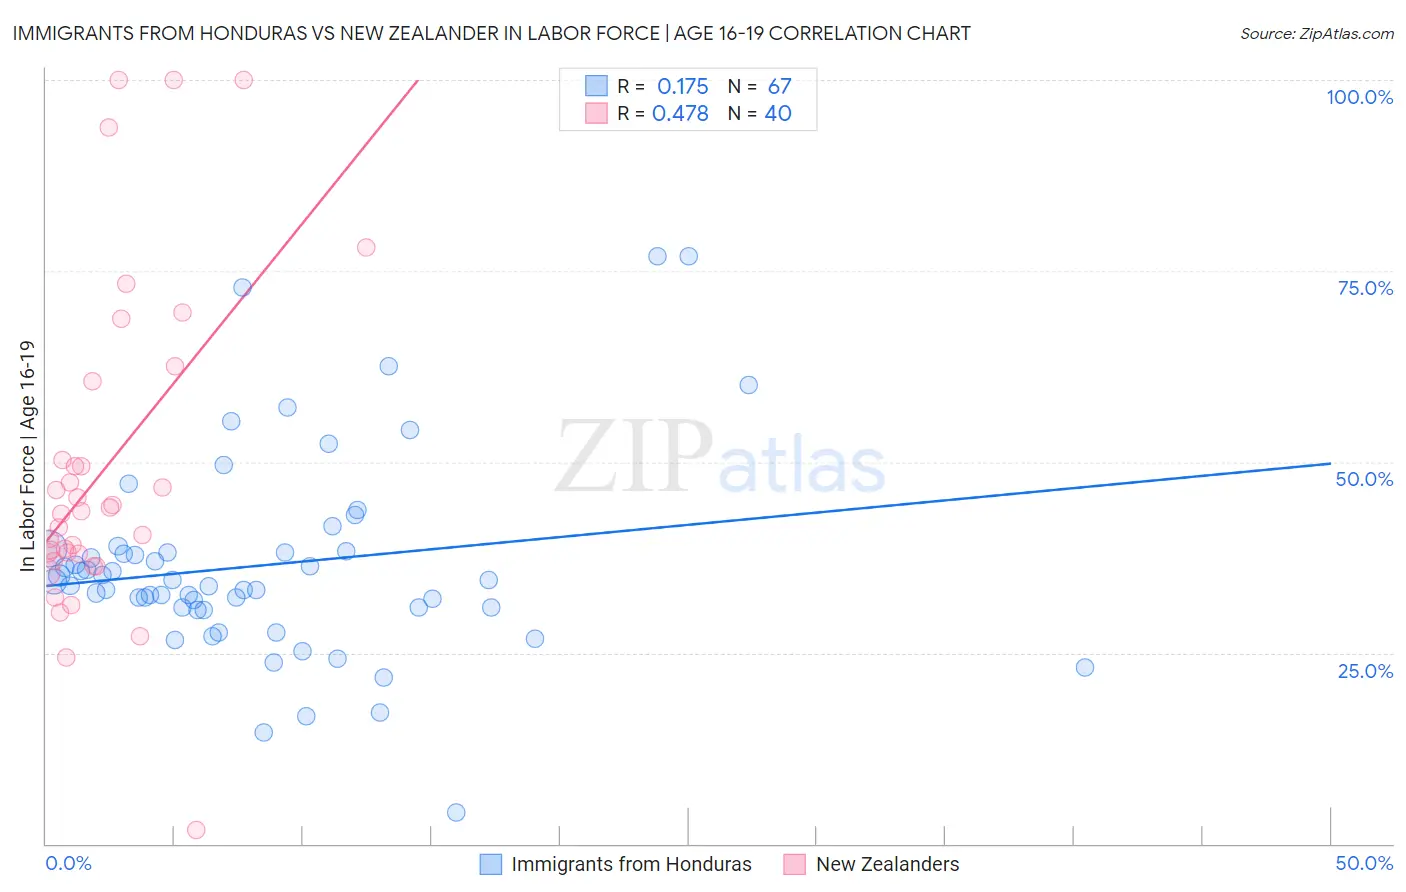
Immigrants from Honduras vs New Zealander In Labor Force | Age 16-19 Correlation Chart
The statistical analysis conducted on geographies consisting of 322,269,112 people shows a poor positive correlation between the proportion of Immigrants from Honduras and labor force participation rate among population between the ages 16 and 19 in the United States with a correlation coefficient (R) of 0.175 and weighted average of 35.2%. Similarly, the statistical analysis conducted on geographies consisting of 106,856,856 people shows a moderate positive correlation between the proportion of New Zealanders and labor force participation rate among population between the ages 16 and 19 in the United States with a correlation coefficient (R) of 0.478 and weighted average of 38.0%, a difference of 7.9%.
In Labor Force | Age 16-19 Correlation Summary
| Measurement | Immigrants from Honduras | New Zealander |
| Minimum | 4.1% | 1.8% |
| Maximum | 77.0% | 100.0% |
| Range | 72.9% | 98.2% |
| Mean | 36.5% | 49.0% |
| Median | 34.3% | 43.4% |
| Interquartile 25% (IQ1) | 31.0% | 37.5% |
| Interquartile 75% (IQ3) | 38.2% | 55.4% |
| Interquartile Range (IQR) | 7.2% | 17.8% |
| Standard Deviation (Sample) | 13.2% | 21.7% |
| Standard Deviation (Population) | 13.1% | 21.4% |
Similar Demographics by In Labor Force | Age 16-19
Demographics Similar to Immigrants from Honduras by In Labor Force | Age 16-19
In terms of in labor force | age 16-19, the demographic groups most similar to Immigrants from Honduras are Immigrants from Lebanon (35.2%, a difference of 0.030%), Immigrants from Syria (35.2%, a difference of 0.12%), Immigrants from Kazakhstan (35.2%, a difference of 0.12%), Immigrants from Senegal (35.3%, a difference of 0.16%), and Immigrants from France (35.1%, a difference of 0.17%).
| Demographics | Rating | Rank | In Labor Force | Age 16-19 |
| Ghanaians | 6.5 /100 | #223 | Tragic 35.3% |
| Hondurans | 6.5 /100 | #224 | Tragic 35.3% |
| Immigrants | Belgium | 6.1 /100 | #225 | Tragic 35.3% |
| Immigrants | Guatemala | 5.7 /100 | #226 | Tragic 35.3% |
| Mongolians | 5.7 /100 | #227 | Tragic 35.3% |
| Immigrants | Senegal | 5.5 /100 | #228 | Tragic 35.3% |
| Immigrants | Lebanon | 5.0 /100 | #229 | Tragic 35.2% |
| Immigrants | Honduras | 4.9 /100 | #230 | Tragic 35.2% |
| Immigrants | Syria | 4.5 /100 | #231 | Tragic 35.2% |
| Immigrants | Kazakhstan | 4.5 /100 | #232 | Tragic 35.2% |
| Immigrants | France | 4.3 /100 | #233 | Tragic 35.1% |
| Immigrants | Mexico | 4.2 /100 | #234 | Tragic 35.1% |
| Immigrants | Philippines | 4.0 /100 | #235 | Tragic 35.1% |
| Immigrants | Australia | 3.6 /100 | #236 | Tragic 35.1% |
| Immigrants | India | 3.5 /100 | #237 | Tragic 35.0% |
Demographics Similar to New Zealanders by In Labor Force | Age 16-19
In terms of in labor force | age 16-19, the demographic groups most similar to New Zealanders are Choctaw (38.0%, a difference of 0.0%), African (38.0%, a difference of 0.010%), Spaniard (38.0%, a difference of 0.020%), Immigrants from Zimbabwe (38.0%, a difference of 0.050%), and Immigrants from Austria (37.9%, a difference of 0.15%).
| Demographics | Rating | Rank | In Labor Force | Age 16-19 |
| Ethiopians | 97.4 /100 | #121 | Exceptional 38.2% |
| Guamanians/Chamorros | 97.4 /100 | #122 | Exceptional 38.2% |
| Seminole | 96.7 /100 | #123 | Exceptional 38.1% |
| Immigrants | England | 96.4 /100 | #124 | Exceptional 38.1% |
| Immigrants | Africa | 96.1 /100 | #125 | Exceptional 38.0% |
| Africans | 95.6 /100 | #126 | Exceptional 38.0% |
| Choctaw | 95.6 /100 | #127 | Exceptional 38.0% |
| New Zealanders | 95.6 /100 | #128 | Exceptional 38.0% |
| Spaniards | 95.5 /100 | #129 | Exceptional 38.0% |
| Immigrants | Zimbabwe | 95.4 /100 | #130 | Exceptional 38.0% |
| Immigrants | Austria | 95.0 /100 | #131 | Exceptional 37.9% |
| Immigrants | Oceania | 94.7 /100 | #132 | Exceptional 37.9% |
| Cheyenne | 94.6 /100 | #133 | Exceptional 37.9% |
| Immigrants | Netherlands | 93.7 /100 | #134 | Exceptional 37.8% |
| Macedonians | 93.4 /100 | #135 | Exceptional 37.8% |