Immigrants from Honduras vs Immigrants from Egypt In Labor Force | Age 16-19
COMPARE
Immigrants from Honduras
Immigrants from Egypt
In Labor Force | Age 16-19
In Labor Force | Age 16-19 Comparison
Immigrants from Honduras
Immigrants from Egypt
35.2%
IN LABOR FORCE | AGE 16-19
4.9/ 100
METRIC RATING
230th/ 347
METRIC RANK
34.6%
IN LABOR FORCE | AGE 16-19
1.2/ 100
METRIC RATING
257th/ 347
METRIC RANK
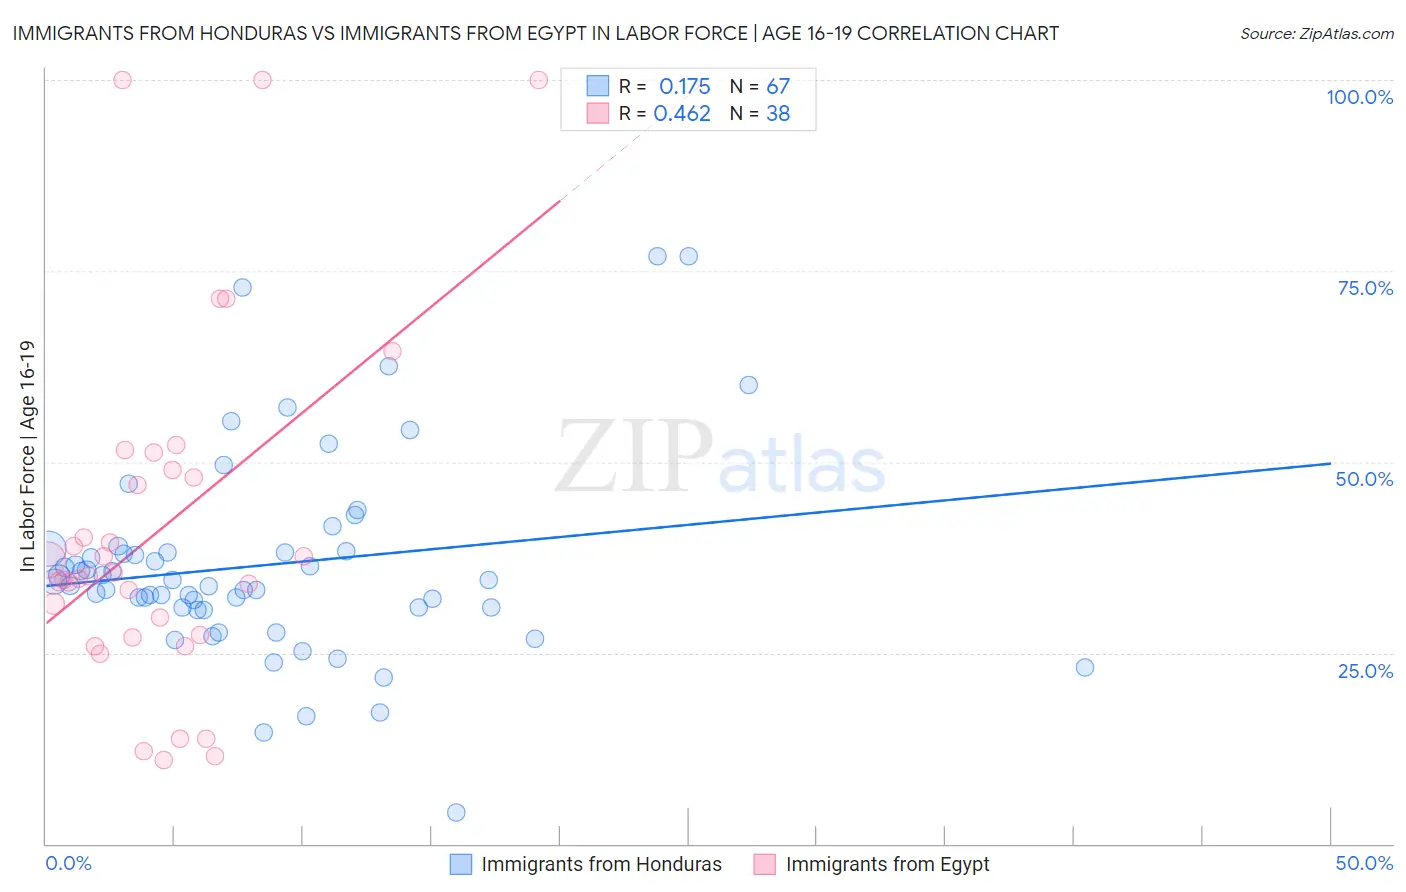
Immigrants from Honduras vs Immigrants from Egypt In Labor Force | Age 16-19 Correlation Chart
The statistical analysis conducted on geographies consisting of 322,269,112 people shows a poor positive correlation between the proportion of Immigrants from Honduras and labor force participation rate among population between the ages 16 and 19 in the United States with a correlation coefficient (R) of 0.175 and weighted average of 35.2%. Similarly, the statistical analysis conducted on geographies consisting of 245,278,440 people shows a moderate positive correlation between the proportion of Immigrants from Egypt and labor force participation rate among population between the ages 16 and 19 in the United States with a correlation coefficient (R) of 0.462 and weighted average of 34.6%, a difference of 1.9%.
In Labor Force | Age 16-19 Correlation Summary
| Measurement | Immigrants from Honduras | Immigrants from Egypt |
| Minimum | 4.1% | 11.0% |
| Maximum | 77.0% | 100.0% |
| Range | 72.9% | 89.0% |
| Mean | 36.5% | 41.2% |
| Median | 34.3% | 35.3% |
| Interquartile 25% (IQ1) | 31.0% | 27.4% |
| Interquartile 75% (IQ3) | 38.2% | 48.9% |
| Interquartile Range (IQR) | 7.2% | 21.5% |
| Standard Deviation (Sample) | 13.2% | 22.7% |
| Standard Deviation (Population) | 13.1% | 22.4% |
Similar Demographics by In Labor Force | Age 16-19
Demographics Similar to Immigrants from Honduras by In Labor Force | Age 16-19
In terms of in labor force | age 16-19, the demographic groups most similar to Immigrants from Honduras are Immigrants from Lebanon (35.2%, a difference of 0.030%), Immigrants from Syria (35.2%, a difference of 0.12%), Immigrants from Kazakhstan (35.2%, a difference of 0.12%), Immigrants from Senegal (35.3%, a difference of 0.16%), and Immigrants from France (35.1%, a difference of 0.17%).
| Demographics | Rating | Rank | In Labor Force | Age 16-19 |
| Ghanaians | 6.5 /100 | #223 | Tragic 35.3% |
| Hondurans | 6.5 /100 | #224 | Tragic 35.3% |
| Immigrants | Belgium | 6.1 /100 | #225 | Tragic 35.3% |
| Immigrants | Guatemala | 5.7 /100 | #226 | Tragic 35.3% |
| Mongolians | 5.7 /100 | #227 | Tragic 35.3% |
| Immigrants | Senegal | 5.5 /100 | #228 | Tragic 35.3% |
| Immigrants | Lebanon | 5.0 /100 | #229 | Tragic 35.2% |
| Immigrants | Honduras | 4.9 /100 | #230 | Tragic 35.2% |
| Immigrants | Syria | 4.5 /100 | #231 | Tragic 35.2% |
| Immigrants | Kazakhstan | 4.5 /100 | #232 | Tragic 35.2% |
| Immigrants | France | 4.3 /100 | #233 | Tragic 35.1% |
| Immigrants | Mexico | 4.2 /100 | #234 | Tragic 35.1% |
| Immigrants | Philippines | 4.0 /100 | #235 | Tragic 35.1% |
| Immigrants | Australia | 3.6 /100 | #236 | Tragic 35.1% |
| Immigrants | India | 3.5 /100 | #237 | Tragic 35.0% |
Demographics Similar to Immigrants from Egypt by In Labor Force | Age 16-19
In terms of in labor force | age 16-19, the demographic groups most similar to Immigrants from Egypt are Immigrants from South Central Asia (34.6%, a difference of 0.010%), Thai (34.6%, a difference of 0.010%), Immigrants (34.6%, a difference of 0.020%), Egyptian (34.5%, a difference of 0.10%), and Peruvian (34.6%, a difference of 0.11%).
| Demographics | Rating | Rank | In Labor Force | Age 16-19 |
| Immigrants | Pakistan | 2.0 /100 | #250 | Tragic 34.8% |
| Immigrants | Western Asia | 2.0 /100 | #251 | Tragic 34.8% |
| Immigrants | Chile | 2.0 /100 | #252 | Tragic 34.8% |
| Immigrants | Japan | 1.5 /100 | #253 | Tragic 34.7% |
| Bahamians | 1.4 /100 | #254 | Tragic 34.6% |
| Peruvians | 1.4 /100 | #255 | Tragic 34.6% |
| Immigrants | South Central Asia | 1.3 /100 | #256 | Tragic 34.6% |
| Immigrants | Egypt | 1.2 /100 | #257 | Tragic 34.6% |
| Thais | 1.2 /100 | #258 | Tragic 34.6% |
| Immigrants | Immigrants | 1.2 /100 | #259 | Tragic 34.6% |
| Egyptians | 1.2 /100 | #260 | Tragic 34.5% |
| Salvadorans | 1.1 /100 | #261 | Tragic 34.5% |
| Hispanics or Latinos | 1.1 /100 | #262 | Tragic 34.5% |
| Burmese | 1.1 /100 | #263 | Tragic 34.5% |
| Immigrants | Uruguay | 0.9 /100 | #264 | Tragic 34.4% |