Chickasaw vs Chippewa In Labor Force | Age 30-34
COMPARE
Chickasaw
Chippewa
In Labor Force | Age 30-34
In Labor Force | Age 30-34 Comparison
Chickasaw
Chippewa
81.9%
IN LABOR FORCE | AGE 30-34
0.0/ 100
METRIC RATING
311th/ 347
METRIC RANK
82.6%
IN LABOR FORCE | AGE 30-34
0.0/ 100
METRIC RATING
296th/ 347
METRIC RANK
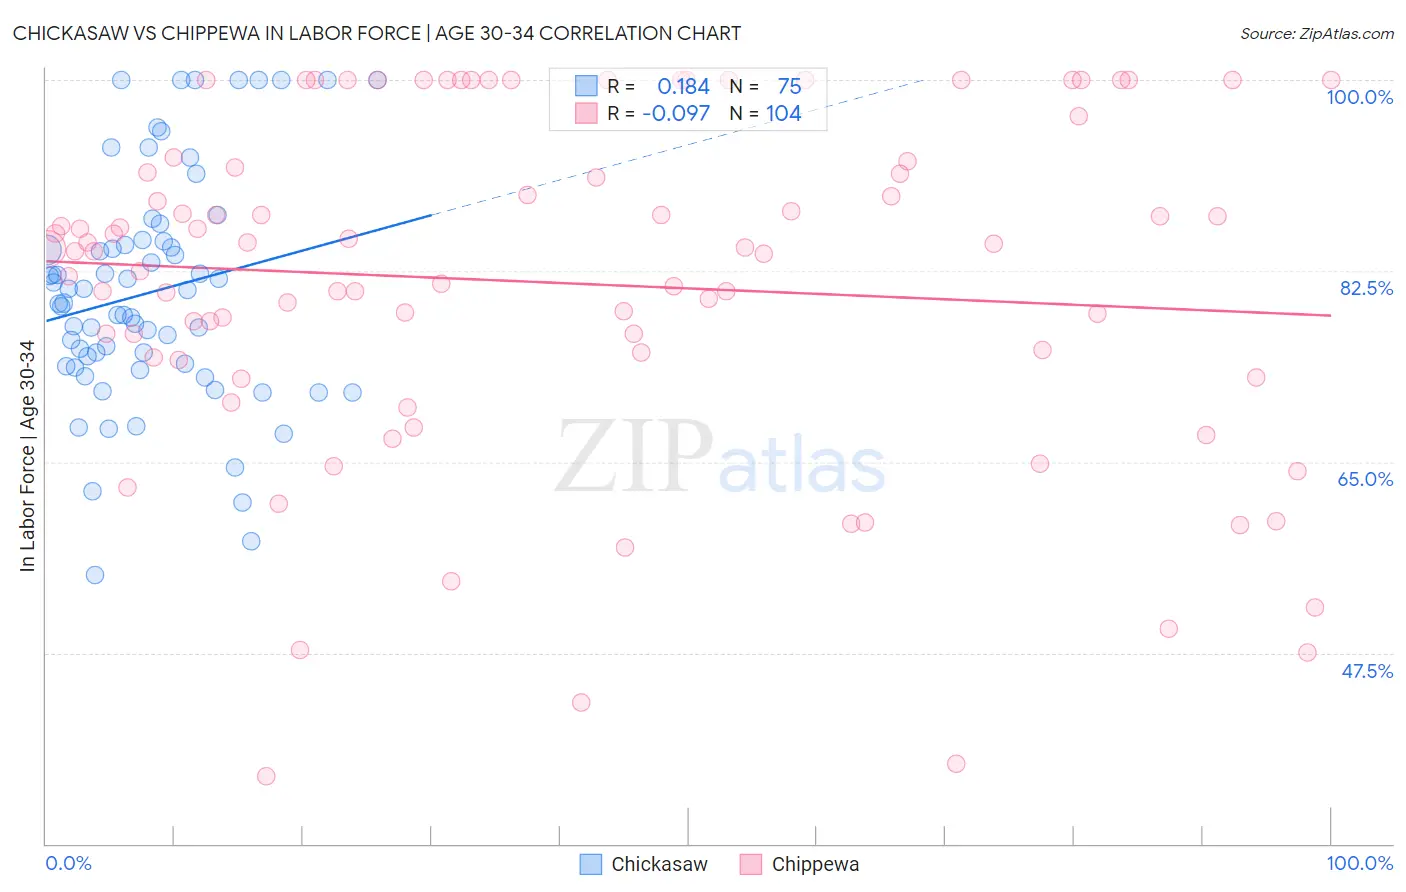
Chickasaw vs Chippewa In Labor Force | Age 30-34 Correlation Chart
The statistical analysis conducted on geographies consisting of 147,694,826 people shows a poor positive correlation between the proportion of Chickasaw and labor force participation rate among population between the ages 30 and 34 in the United States with a correlation coefficient (R) of 0.184 and weighted average of 81.9%. Similarly, the statistical analysis conducted on geographies consisting of 214,981,343 people shows a slight negative correlation between the proportion of Chippewa and labor force participation rate among population between the ages 30 and 34 in the United States with a correlation coefficient (R) of -0.097 and weighted average of 82.6%, a difference of 0.81%.
In Labor Force | Age 30-34 Correlation Summary
| Measurement | Chickasaw | Chippewa |
| Minimum | 54.6% | 36.2% |
| Maximum | 100.0% | 100.0% |
| Range | 45.4% | 63.8% |
| Mean | 80.6% | 81.4% |
| Median | 79.6% | 84.4% |
| Interquartile 25% (IQ1) | 73.8% | 74.4% |
| Interquartile 75% (IQ3) | 85.2% | 92.2% |
| Interquartile Range (IQR) | 11.4% | 17.8% |
| Standard Deviation (Sample) | 10.5% | 15.7% |
| Standard Deviation (Population) | 10.4% | 15.6% |
Demographics Similar to Chickasaw and Chippewa by In Labor Force | Age 30-34
In terms of in labor force | age 30-34, the demographic groups most similar to Chickasaw are Mexican (81.9%, a difference of 0.0%), Iroquois (81.9%, a difference of 0.020%), Cajun (82.0%, a difference of 0.050%), Immigrants from Mexico (82.0%, a difference of 0.070%), and Puget Sound Salish (82.1%, a difference of 0.24%). Similarly, the demographic groups most similar to Chippewa are Comanche (82.6%, a difference of 0.010%), Aleut (82.6%, a difference of 0.010%), Pennsylvania German (82.6%, a difference of 0.020%), American (82.7%, a difference of 0.14%), and Immigrants from Central America (82.5%, a difference of 0.14%).
| Demographics | Rating | Rank | In Labor Force | Age 30-34 |
| Nepalese | 0.0 /100 | #293 | Tragic 82.7% |
| Americans | 0.0 /100 | #294 | Tragic 82.7% |
| Pennsylvania Germans | 0.0 /100 | #295 | Tragic 82.6% |
| Chippewa | 0.0 /100 | #296 | Tragic 82.6% |
| Comanche | 0.0 /100 | #297 | Tragic 82.6% |
| Aleuts | 0.0 /100 | #298 | Tragic 82.6% |
| Immigrants | Central America | 0.0 /100 | #299 | Tragic 82.5% |
| Hmong | 0.0 /100 | #300 | Tragic 82.4% |
| Hispanics or Latinos | 0.0 /100 | #301 | Tragic 82.4% |
| Ottawa | 0.0 /100 | #302 | Tragic 82.4% |
| Immigrants | Micronesia | 0.0 /100 | #303 | Tragic 82.4% |
| Tlingit-Haida | 0.0 /100 | #304 | Tragic 82.3% |
| Osage | 0.0 /100 | #305 | Tragic 82.3% |
| Spanish American Indians | 0.0 /100 | #306 | Tragic 82.2% |
| Menominee | 0.0 /100 | #307 | Tragic 82.2% |
| Puget Sound Salish | 0.0 /100 | #308 | Tragic 82.1% |
| Immigrants | Mexico | 0.0 /100 | #309 | Tragic 82.0% |
| Cajuns | 0.0 /100 | #310 | Tragic 82.0% |
| Chickasaw | 0.0 /100 | #311 | Tragic 81.9% |
| Mexicans | 0.0 /100 | #312 | Tragic 81.9% |
| Iroquois | 0.0 /100 | #313 | Tragic 81.9% |