Immigrants from South Eastern Asia vs Chippewa In Labor Force | Age 30-34
COMPARE
Immigrants from South Eastern Asia
Chippewa
In Labor Force | Age 30-34
In Labor Force | Age 30-34 Comparison
Immigrants from South Eastern Asia
Chippewa
84.7%
IN LABOR FORCE | AGE 30-34
54.2/ 100
METRIC RATING
167th/ 347
METRIC RANK
82.6%
IN LABOR FORCE | AGE 30-34
0.0/ 100
METRIC RATING
296th/ 347
METRIC RANK
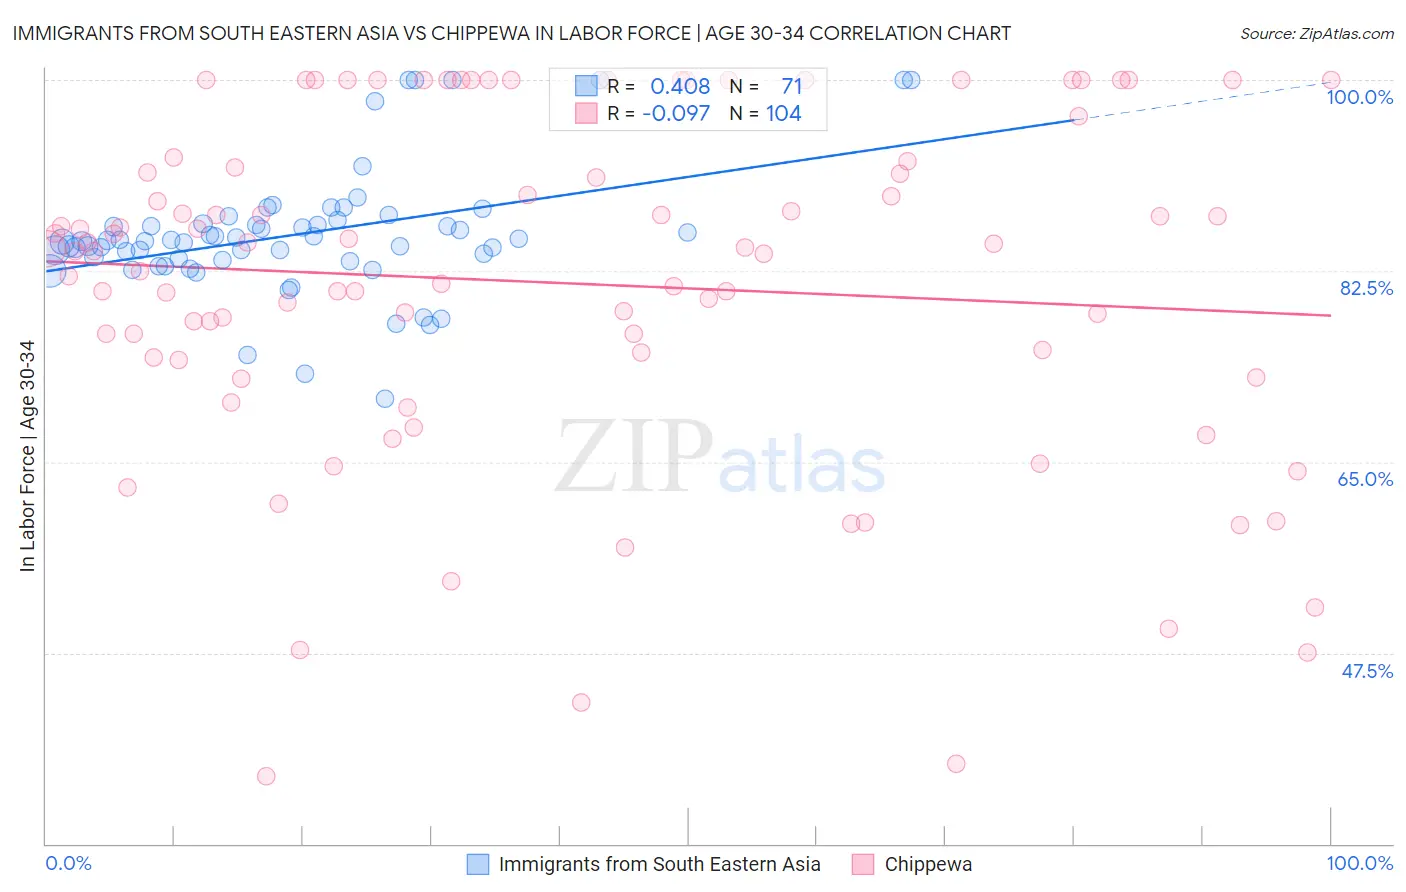
Immigrants from South Eastern Asia vs Chippewa In Labor Force | Age 30-34 Correlation Chart
The statistical analysis conducted on geographies consisting of 512,225,276 people shows a moderate positive correlation between the proportion of Immigrants from South Eastern Asia and labor force participation rate among population between the ages 30 and 34 in the United States with a correlation coefficient (R) of 0.408 and weighted average of 84.7%. Similarly, the statistical analysis conducted on geographies consisting of 214,981,343 people shows a slight negative correlation between the proportion of Chippewa and labor force participation rate among population between the ages 30 and 34 in the United States with a correlation coefficient (R) of -0.097 and weighted average of 82.6%, a difference of 2.6%.
In Labor Force | Age 30-34 Correlation Summary
| Measurement | Immigrants from South Eastern Asia | Chippewa |
| Minimum | 70.7% | 36.2% |
| Maximum | 100.0% | 100.0% |
| Range | 29.3% | 63.8% |
| Mean | 85.8% | 81.4% |
| Median | 85.2% | 84.4% |
| Interquartile 25% (IQ1) | 83.5% | 74.4% |
| Interquartile 75% (IQ3) | 86.9% | 92.2% |
| Interquartile Range (IQR) | 3.4% | 17.8% |
| Standard Deviation (Sample) | 5.8% | 15.7% |
| Standard Deviation (Population) | 5.8% | 15.6% |
Similar Demographics by In Labor Force | Age 30-34
Demographics Similar to Immigrants from South Eastern Asia by In Labor Force | Age 30-34
In terms of in labor force | age 30-34, the demographic groups most similar to Immigrants from South Eastern Asia are Afghan (84.7%, a difference of 0.010%), Immigrants from Peru (84.7%, a difference of 0.010%), South American Indian (84.7%, a difference of 0.010%), Immigrants from Uruguay (84.7%, a difference of 0.020%), and Icelander (84.7%, a difference of 0.020%).
| Demographics | Rating | Rank | In Labor Force | Age 30-34 |
| Pakistanis | 60.8 /100 | #160 | Good 84.7% |
| Immigrants | Cambodia | 60.7 /100 | #161 | Good 84.7% |
| South Americans | 58.7 /100 | #162 | Average 84.7% |
| Immigrants | Uruguay | 57.4 /100 | #163 | Average 84.7% |
| Icelanders | 56.8 /100 | #164 | Average 84.7% |
| Immigrants | Western Europe | 56.7 /100 | #165 | Average 84.7% |
| Afghans | 55.2 /100 | #166 | Average 84.7% |
| Immigrants | South Eastern Asia | 54.2 /100 | #167 | Average 84.7% |
| Immigrants | Peru | 52.4 /100 | #168 | Average 84.7% |
| South American Indians | 52.1 /100 | #169 | Average 84.7% |
| Immigrants | Burma/Myanmar | 52.0 /100 | #170 | Average 84.7% |
| Irish | 52.0 /100 | #171 | Average 84.7% |
| Immigrants | England | 51.7 /100 | #172 | Average 84.7% |
| Israelis | 51.1 /100 | #173 | Average 84.7% |
| Finns | 50.0 /100 | #174 | Average 84.7% |
Demographics Similar to Chippewa by In Labor Force | Age 30-34
In terms of in labor force | age 30-34, the demographic groups most similar to Chippewa are Comanche (82.6%, a difference of 0.010%), Aleut (82.6%, a difference of 0.010%), Pennsylvania German (82.6%, a difference of 0.020%), American (82.7%, a difference of 0.14%), and Immigrants from Central America (82.5%, a difference of 0.14%).
| Demographics | Rating | Rank | In Labor Force | Age 30-34 |
| Hawaiians | 0.0 /100 | #289 | Tragic 83.0% |
| Blackfeet | 0.0 /100 | #290 | Tragic 82.8% |
| Potawatomi | 0.0 /100 | #291 | Tragic 82.8% |
| Blacks/African Americans | 0.0 /100 | #292 | Tragic 82.8% |
| Nepalese | 0.0 /100 | #293 | Tragic 82.7% |
| Americans | 0.0 /100 | #294 | Tragic 82.7% |
| Pennsylvania Germans | 0.0 /100 | #295 | Tragic 82.6% |
| Chippewa | 0.0 /100 | #296 | Tragic 82.6% |
| Comanche | 0.0 /100 | #297 | Tragic 82.6% |
| Aleuts | 0.0 /100 | #298 | Tragic 82.6% |
| Immigrants | Central America | 0.0 /100 | #299 | Tragic 82.5% |
| Hmong | 0.0 /100 | #300 | Tragic 82.4% |
| Hispanics or Latinos | 0.0 /100 | #301 | Tragic 82.4% |
| Ottawa | 0.0 /100 | #302 | Tragic 82.4% |
| Immigrants | Micronesia | 0.0 /100 | #303 | Tragic 82.4% |