Immigrants from Honduras vs Tsimshian In Labor Force | Age 30-34
COMPARE
Immigrants from Honduras
Tsimshian
In Labor Force | Age 30-34
In Labor Force | Age 30-34 Comparison
Immigrants from Honduras
Tsimshian
83.7%
IN LABOR FORCE | AGE 30-34
0.1/ 100
METRIC RATING
265th/ 347
METRIC RANK
85.8%
IN LABOR FORCE | AGE 30-34
100.0/ 100
METRIC RATING
29th/ 347
METRIC RANK
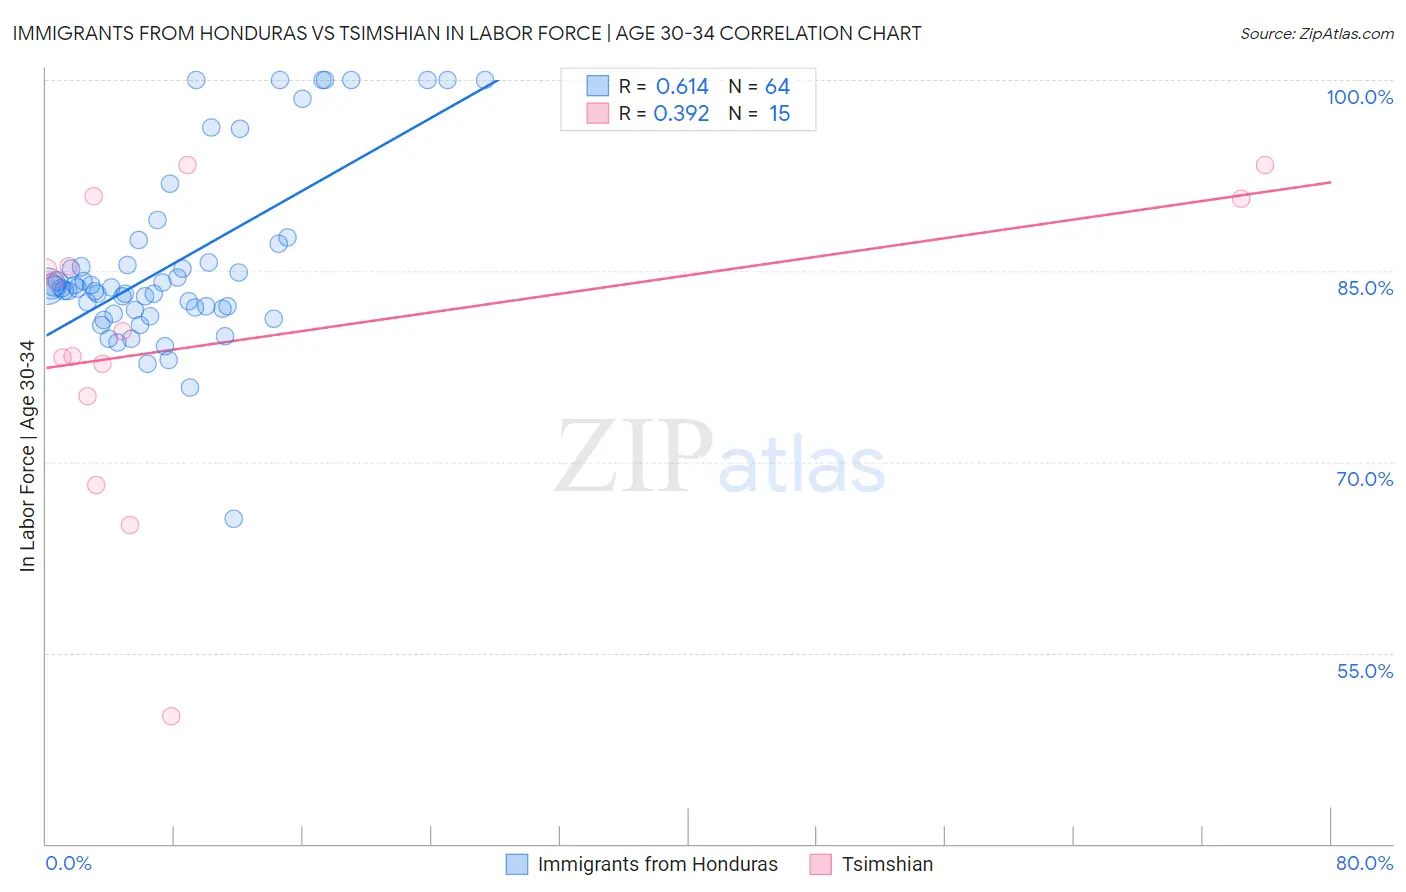
Immigrants from Honduras vs Tsimshian In Labor Force | Age 30-34 Correlation Chart
The statistical analysis conducted on geographies consisting of 322,455,880 people shows a significant positive correlation between the proportion of Immigrants from Honduras and labor force participation rate among population between the ages 30 and 34 in the United States with a correlation coefficient (R) of 0.614 and weighted average of 83.7%. Similarly, the statistical analysis conducted on geographies consisting of 15,624,837 people shows a mild positive correlation between the proportion of Tsimshian and labor force participation rate among population between the ages 30 and 34 in the United States with a correlation coefficient (R) of 0.392 and weighted average of 85.8%, a difference of 2.5%.
In Labor Force | Age 30-34 Correlation Summary
| Measurement | Immigrants from Honduras | Tsimshian |
| Minimum | 65.5% | 50.0% |
| Maximum | 100.0% | 93.3% |
| Range | 34.5% | 43.3% |
| Mean | 85.6% | 79.7% |
| Median | 83.7% | 80.3% |
| Interquartile 25% (IQ1) | 81.9% | 75.2% |
| Interquartile 75% (IQ3) | 86.4% | 90.7% |
| Interquartile Range (IQR) | 4.5% | 15.5% |
| Standard Deviation (Sample) | 7.1% | 11.8% |
| Standard Deviation (Population) | 7.1% | 11.4% |
Similar Demographics by In Labor Force | Age 30-34
Demographics Similar to Immigrants from Honduras by In Labor Force | Age 30-34
In terms of in labor force | age 30-34, the demographic groups most similar to Immigrants from Honduras are Immigrants from Guatemala (83.7%, a difference of 0.020%), Guatemalan (83.7%, a difference of 0.030%), Dominican (83.8%, a difference of 0.080%), Immigrants from Guyana (83.8%, a difference of 0.080%), and Guyanese (83.8%, a difference of 0.10%).
| Demographics | Rating | Rank | In Labor Force | Age 30-34 |
| Hondurans | 0.3 /100 | #258 | Tragic 83.8% |
| Scotch-Irish | 0.3 /100 | #259 | Tragic 83.8% |
| Immigrants | Dominican Republic | 0.3 /100 | #260 | Tragic 83.8% |
| Guyanese | 0.3 /100 | #261 | Tragic 83.8% |
| Dominicans | 0.2 /100 | #262 | Tragic 83.8% |
| Immigrants | Guyana | 0.2 /100 | #263 | Tragic 83.8% |
| Guatemalans | 0.2 /100 | #264 | Tragic 83.7% |
| Immigrants | Honduras | 0.1 /100 | #265 | Tragic 83.7% |
| Immigrants | Guatemala | 0.1 /100 | #266 | Tragic 83.7% |
| Spaniards | 0.1 /100 | #267 | Tragic 83.6% |
| Immigrants | Bangladesh | 0.1 /100 | #268 | Tragic 83.6% |
| Vietnamese | 0.1 /100 | #269 | Tragic 83.6% |
| Spanish Americans | 0.0 /100 | #270 | Tragic 83.5% |
| Spanish | 0.0 /100 | #271 | Tragic 83.5% |
| Immigrants | Nonimmigrants | 0.0 /100 | #272 | Tragic 83.5% |
Demographics Similar to Tsimshian by In Labor Force | Age 30-34
In terms of in labor force | age 30-34, the demographic groups most similar to Tsimshian are Immigrants from Latvia (85.9%, a difference of 0.030%), Immigrants from Hong Kong (85.8%, a difference of 0.040%), Paraguayan (85.8%, a difference of 0.050%), Cypriot (85.8%, a difference of 0.060%), and Immigrants from Liberia (85.9%, a difference of 0.070%).
| Demographics | Rating | Rank | In Labor Force | Age 30-34 |
| Bermudans | 100.0 /100 | #22 | Exceptional 85.9% |
| Estonians | 100.0 /100 | #23 | Exceptional 85.9% |
| Immigrants | Eritrea | 100.0 /100 | #24 | Exceptional 85.9% |
| Immigrants | North Macedonia | 100.0 /100 | #25 | Exceptional 85.9% |
| Immigrants | Eastern Africa | 100.0 /100 | #26 | Exceptional 85.9% |
| Immigrants | Liberia | 100.0 /100 | #27 | Exceptional 85.9% |
| Immigrants | Latvia | 100.0 /100 | #28 | Exceptional 85.9% |
| Tsimshian | 100.0 /100 | #29 | Exceptional 85.8% |
| Immigrants | Hong Kong | 100.0 /100 | #30 | Exceptional 85.8% |
| Paraguayans | 99.9 /100 | #31 | Exceptional 85.8% |
| Cypriots | 99.9 /100 | #32 | Exceptional 85.8% |
| Immigrants | Bosnia and Herzegovina | 99.9 /100 | #33 | Exceptional 85.8% |
| Ugandans | 99.9 /100 | #34 | Exceptional 85.8% |
| Serbians | 99.9 /100 | #35 | Exceptional 85.8% |
| Albanians | 99.9 /100 | #36 | Exceptional 85.7% |