Salvadoran vs Chippewa In Labor Force | Age 30-34
COMPARE
Salvadoran
Chippewa
In Labor Force | Age 30-34
In Labor Force | Age 30-34 Comparison
Salvadorans
Chippewa
84.2%
IN LABOR FORCE | AGE 30-34
3.8/ 100
METRIC RATING
221st/ 347
METRIC RANK
82.6%
IN LABOR FORCE | AGE 30-34
0.0/ 100
METRIC RATING
296th/ 347
METRIC RANK
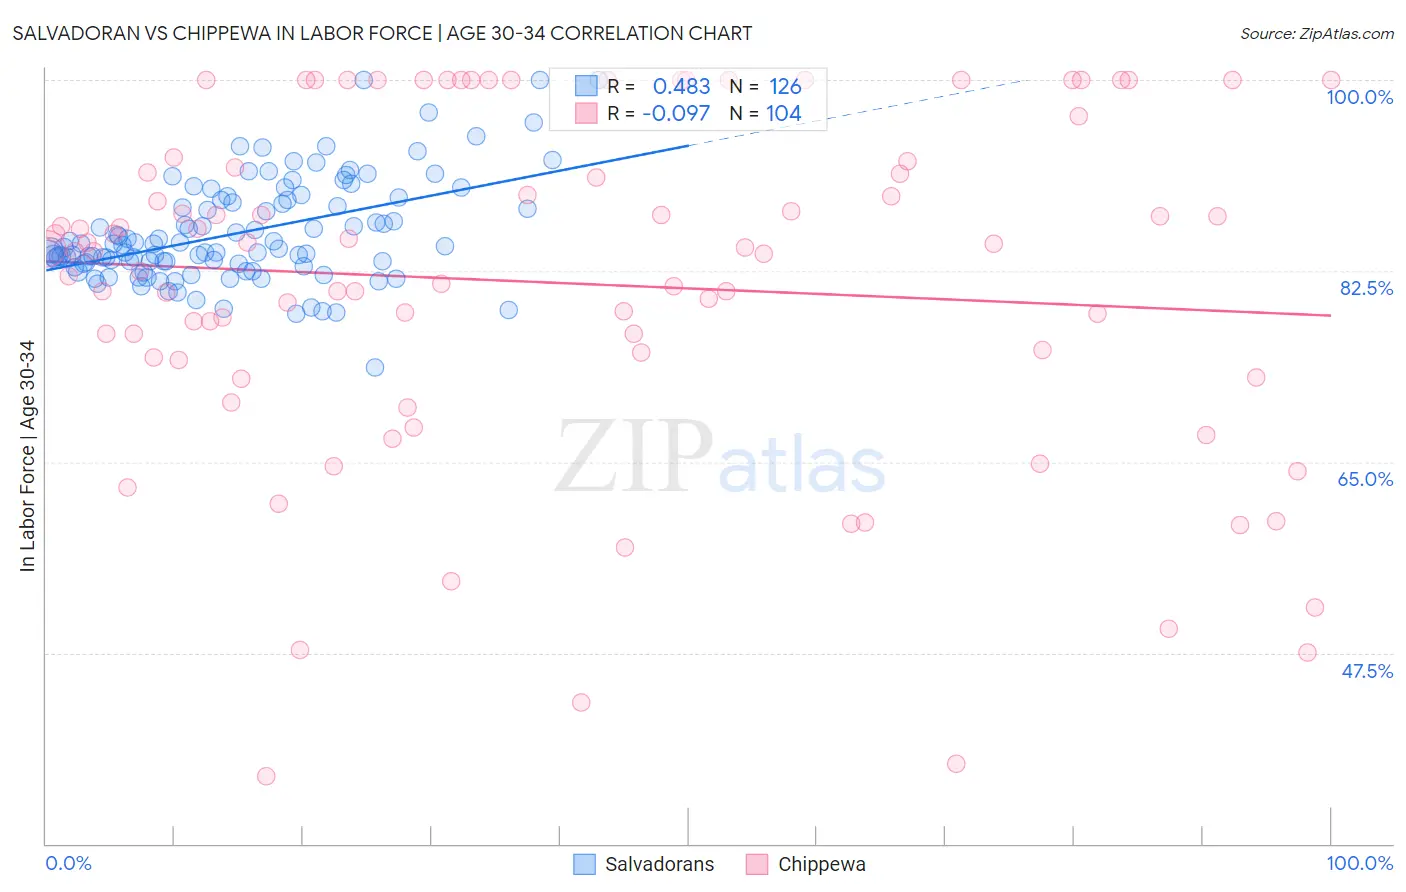
Salvadoran vs Chippewa In Labor Force | Age 30-34 Correlation Chart
The statistical analysis conducted on geographies consisting of 398,763,176 people shows a moderate positive correlation between the proportion of Salvadorans and labor force participation rate among population between the ages 30 and 34 in the United States with a correlation coefficient (R) of 0.483 and weighted average of 84.2%. Similarly, the statistical analysis conducted on geographies consisting of 214,981,343 people shows a slight negative correlation between the proportion of Chippewa and labor force participation rate among population between the ages 30 and 34 in the United States with a correlation coefficient (R) of -0.097 and weighted average of 82.6%, a difference of 2.0%.
In Labor Force | Age 30-34 Correlation Summary
| Measurement | Salvadoran | Chippewa |
| Minimum | 73.6% | 36.2% |
| Maximum | 100.0% | 100.0% |
| Range | 26.4% | 63.8% |
| Mean | 86.0% | 81.4% |
| Median | 84.7% | 84.4% |
| Interquartile 25% (IQ1) | 83.2% | 74.4% |
| Interquartile 75% (IQ3) | 89.0% | 92.2% |
| Interquartile Range (IQR) | 5.8% | 17.8% |
| Standard Deviation (Sample) | 4.7% | 15.7% |
| Standard Deviation (Population) | 4.7% | 15.6% |
Similar Demographics by In Labor Force | Age 30-34
Demographics Similar to Salvadorans by In Labor Force | Age 30-34
In terms of in labor force | age 30-34, the demographic groups most similar to Salvadorans are Panamanian (84.2%, a difference of 0.0%), Immigrants from Laos (84.2%, a difference of 0.010%), Cuban (84.2%, a difference of 0.020%), Scottish (84.2%, a difference of 0.040%), and Immigrants from El Salvador (84.2%, a difference of 0.040%).
| Demographics | Rating | Rank | In Labor Force | Age 30-34 |
| Immigrants | Germany | 7.2 /100 | #214 | Tragic 84.3% |
| Europeans | 7.2 /100 | #215 | Tragic 84.3% |
| Immigrants | Ecuador | 7.1 /100 | #216 | Tragic 84.3% |
| Immigrants | Trinidad and Tobago | 7.0 /100 | #217 | Tragic 84.3% |
| Immigrants | Panama | 6.3 /100 | #218 | Tragic 84.3% |
| Swiss | 5.8 /100 | #219 | Tragic 84.3% |
| Danes | 5.3 /100 | #220 | Tragic 84.3% |
| Salvadorans | 3.8 /100 | #221 | Tragic 84.2% |
| Panamanians | 3.8 /100 | #222 | Tragic 84.2% |
| Immigrants | Laos | 3.6 /100 | #223 | Tragic 84.2% |
| Cubans | 3.4 /100 | #224 | Tragic 84.2% |
| Scottish | 3.1 /100 | #225 | Tragic 84.2% |
| Immigrants | El Salvador | 3.0 /100 | #226 | Tragic 84.2% |
| Immigrants | Cuba | 3.0 /100 | #227 | Tragic 84.2% |
| Immigrants | Haiti | 2.8 /100 | #228 | Tragic 84.2% |
Demographics Similar to Chippewa by In Labor Force | Age 30-34
In terms of in labor force | age 30-34, the demographic groups most similar to Chippewa are Comanche (82.6%, a difference of 0.010%), Aleut (82.6%, a difference of 0.010%), Pennsylvania German (82.6%, a difference of 0.020%), American (82.7%, a difference of 0.14%), and Immigrants from Central America (82.5%, a difference of 0.14%).
| Demographics | Rating | Rank | In Labor Force | Age 30-34 |
| Hawaiians | 0.0 /100 | #289 | Tragic 83.0% |
| Blackfeet | 0.0 /100 | #290 | Tragic 82.8% |
| Potawatomi | 0.0 /100 | #291 | Tragic 82.8% |
| Blacks/African Americans | 0.0 /100 | #292 | Tragic 82.8% |
| Nepalese | 0.0 /100 | #293 | Tragic 82.7% |
| Americans | 0.0 /100 | #294 | Tragic 82.7% |
| Pennsylvania Germans | 0.0 /100 | #295 | Tragic 82.6% |
| Chippewa | 0.0 /100 | #296 | Tragic 82.6% |
| Comanche | 0.0 /100 | #297 | Tragic 82.6% |
| Aleuts | 0.0 /100 | #298 | Tragic 82.6% |
| Immigrants | Central America | 0.0 /100 | #299 | Tragic 82.5% |
| Hmong | 0.0 /100 | #300 | Tragic 82.4% |
| Hispanics or Latinos | 0.0 /100 | #301 | Tragic 82.4% |
| Ottawa | 0.0 /100 | #302 | Tragic 82.4% |
| Immigrants | Micronesia | 0.0 /100 | #303 | Tragic 82.4% |