Immigrants from Guyana vs Canadian In Labor Force | Age 35-44
COMPARE
Immigrants from Guyana
Canadian
In Labor Force | Age 35-44
In Labor Force | Age 35-44 Comparison
Immigrants from Guyana
Canadians
83.6%
IN LABOR FORCE | AGE 35-44
0.4/ 100
METRIC RATING
252nd/ 347
METRIC RANK
84.2%
IN LABOR FORCE | AGE 35-44
19.9/ 100
METRIC RATING
204th/ 347
METRIC RANK
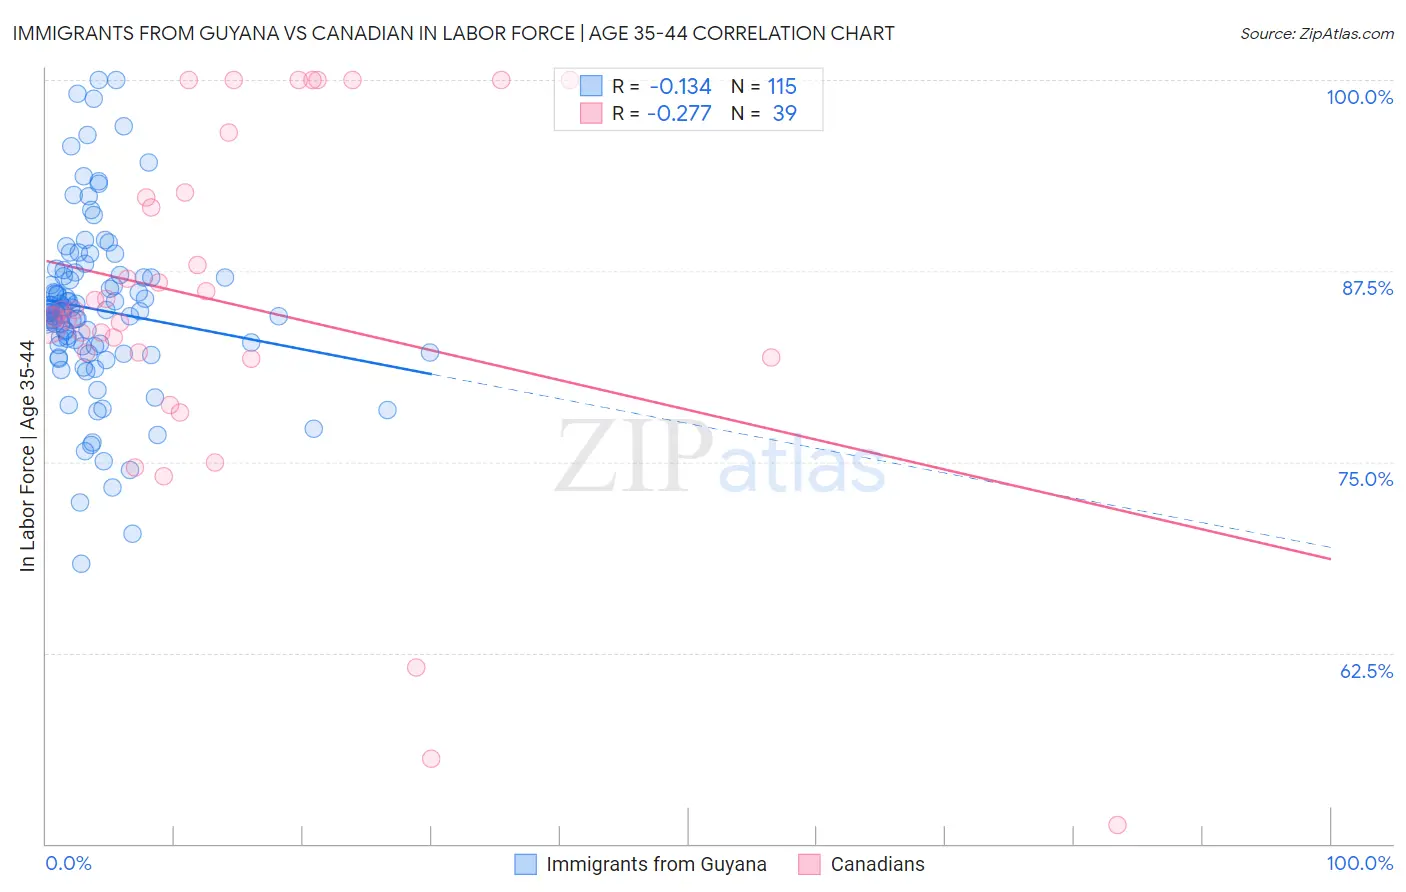
Immigrants from Guyana vs Canadian In Labor Force | Age 35-44 Correlation Chart
The statistical analysis conducted on geographies consisting of 183,700,489 people shows a poor negative correlation between the proportion of Immigrants from Guyana and labor force participation rate among population between the ages 35 and 44 in the United States with a correlation coefficient (R) of -0.134 and weighted average of 83.6%. Similarly, the statistical analysis conducted on geographies consisting of 437,310,598 people shows a weak negative correlation between the proportion of Canadians and labor force participation rate among population between the ages 35 and 44 in the United States with a correlation coefficient (R) of -0.277 and weighted average of 84.2%, a difference of 0.66%.
In Labor Force | Age 35-44 Correlation Summary
| Measurement | Immigrants from Guyana | Canadian |
| Minimum | 68.4% | 51.2% |
| Maximum | 100.0% | 100.0% |
| Range | 31.6% | 48.8% |
| Mean | 85.0% | 85.3% |
| Median | 84.8% | 84.9% |
| Interquartile 25% (IQ1) | 82.5% | 81.8% |
| Interquartile 75% (IQ3) | 87.2% | 92.7% |
| Interquartile Range (IQR) | 4.6% | 10.9% |
| Standard Deviation (Sample) | 5.7% | 11.6% |
| Standard Deviation (Population) | 5.7% | 11.5% |
Similar Demographics by In Labor Force | Age 35-44
Demographics Similar to Immigrants from Guyana by In Labor Force | Age 35-44
In terms of in labor force | age 35-44, the demographic groups most similar to Immigrants from Guyana are Salvadoran (83.6%, a difference of 0.0%), Lebanese (83.6%, a difference of 0.0%), Tongan (83.6%, a difference of 0.010%), White/Caucasian (83.6%, a difference of 0.020%), and Immigrants from the Azores (83.6%, a difference of 0.040%).
| Demographics | Rating | Rank | In Labor Force | Age 35-44 |
| Malaysians | 1.1 /100 | #245 | Tragic 83.8% |
| Immigrants | Immigrants | 1.0 /100 | #246 | Tragic 83.7% |
| Immigrants | Armenia | 0.9 /100 | #247 | Tragic 83.7% |
| Indonesians | 0.8 /100 | #248 | Tragic 83.7% |
| Immigrants | St. Vincent and the Grenadines | 0.7 /100 | #249 | Tragic 83.7% |
| Whites/Caucasians | 0.5 /100 | #250 | Tragic 83.6% |
| Salvadorans | 0.4 /100 | #251 | Tragic 83.6% |
| Immigrants | Guyana | 0.4 /100 | #252 | Tragic 83.6% |
| Lebanese | 0.4 /100 | #253 | Tragic 83.6% |
| Tongans | 0.4 /100 | #254 | Tragic 83.6% |
| Immigrants | Azores | 0.3 /100 | #255 | Tragic 83.6% |
| Japanese | 0.3 /100 | #256 | Tragic 83.6% |
| Basques | 0.3 /100 | #257 | Tragic 83.6% |
| Tsimshian | 0.2 /100 | #258 | Tragic 83.5% |
| Immigrants | El Salvador | 0.2 /100 | #259 | Tragic 83.5% |
Demographics Similar to Canadians by In Labor Force | Age 35-44
In terms of in labor force | age 35-44, the demographic groups most similar to Canadians are Immigrants from Canada (84.2%, a difference of 0.0%), Immigrants from Costa Rica (84.2%, a difference of 0.0%), Laotian (84.2%, a difference of 0.010%), Immigrants from South Eastern Asia (84.2%, a difference of 0.020%), and Immigrants from North America (84.2%, a difference of 0.020%).
| Demographics | Rating | Rank | In Labor Force | Age 35-44 |
| Immigrants | Western Europe | 24.7 /100 | #197 | Fair 84.2% |
| Ecuadorians | 24.0 /100 | #198 | Fair 84.2% |
| Syrians | 23.2 /100 | #199 | Fair 84.2% |
| Moroccans | 23.2 /100 | #200 | Fair 84.2% |
| British | 23.0 /100 | #201 | Fair 84.2% |
| Immigrants | Uzbekistan | 22.8 /100 | #202 | Fair 84.2% |
| Immigrants | South Eastern Asia | 22.4 /100 | #203 | Fair 84.2% |
| Canadians | 19.9 /100 | #204 | Poor 84.2% |
| Immigrants | Canada | 19.6 /100 | #205 | Poor 84.2% |
| Immigrants | Costa Rica | 19.5 /100 | #206 | Poor 84.2% |
| Laotians | 19.0 /100 | #207 | Poor 84.2% |
| Immigrants | North America | 18.1 /100 | #208 | Poor 84.2% |
| Swiss | 17.4 /100 | #209 | Poor 84.2% |
| New Zealanders | 16.2 /100 | #210 | Poor 84.1% |
| Immigrants | Ecuador | 15.2 /100 | #211 | Poor 84.1% |