Immigrants from Guyana vs Arapaho In Labor Force | Age 35-44
COMPARE
Immigrants from Guyana
Arapaho
In Labor Force | Age 35-44
In Labor Force | Age 35-44 Comparison
Immigrants from Guyana
Arapaho
83.6%
IN LABOR FORCE | AGE 35-44
0.4/ 100
METRIC RATING
252nd/ 347
METRIC RANK
78.1%
IN LABOR FORCE | AGE 35-44
0.0/ 100
METRIC RATING
336th/ 347
METRIC RANK
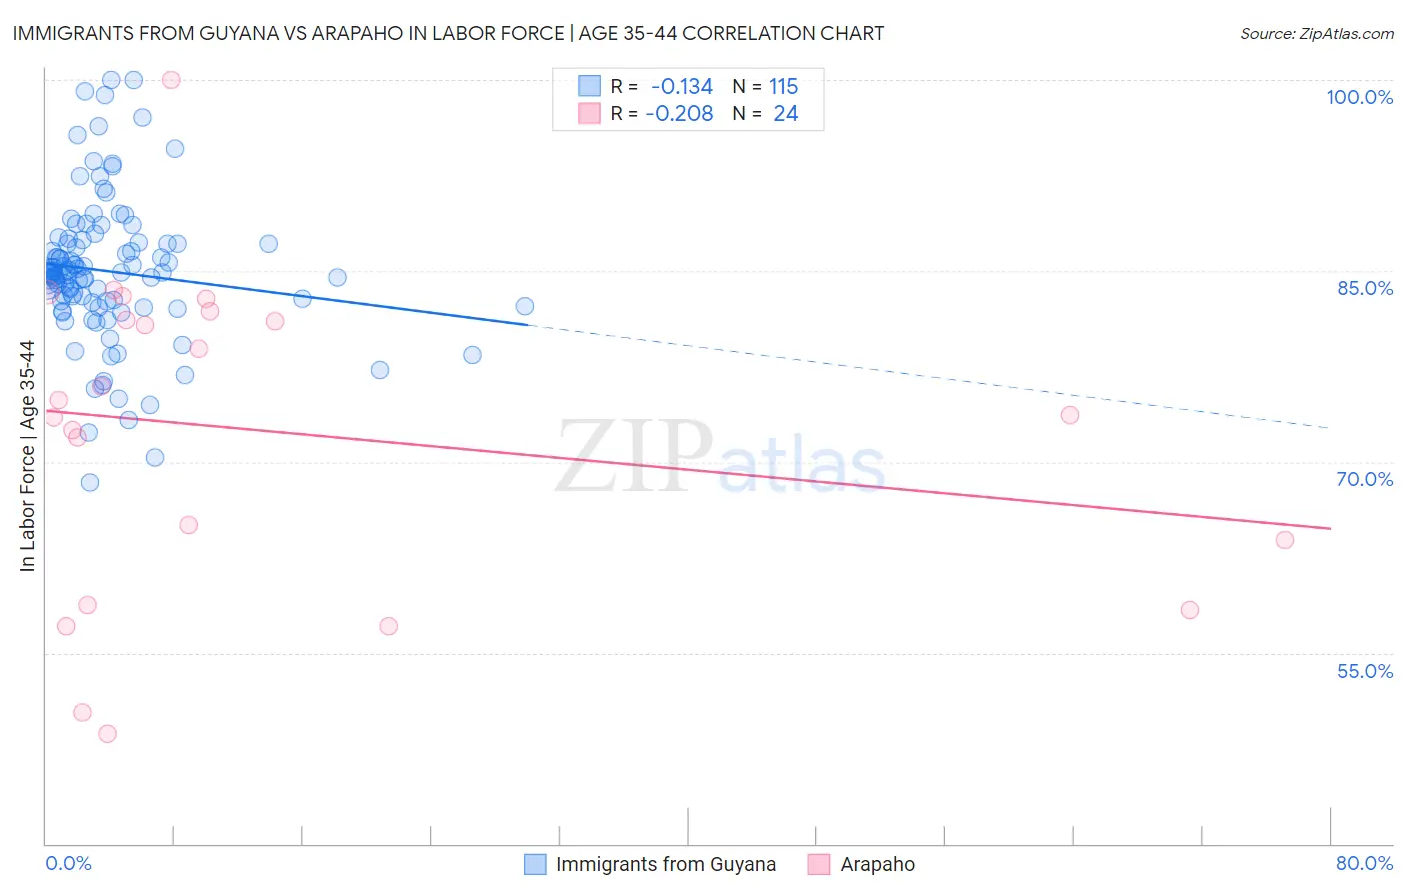
Immigrants from Guyana vs Arapaho In Labor Force | Age 35-44 Correlation Chart
The statistical analysis conducted on geographies consisting of 183,700,489 people shows a poor negative correlation between the proportion of Immigrants from Guyana and labor force participation rate among population between the ages 35 and 44 in the United States with a correlation coefficient (R) of -0.134 and weighted average of 83.6%. Similarly, the statistical analysis conducted on geographies consisting of 29,776,637 people shows a weak negative correlation between the proportion of Arapaho and labor force participation rate among population between the ages 35 and 44 in the United States with a correlation coefficient (R) of -0.208 and weighted average of 78.1%, a difference of 7.1%.
In Labor Force | Age 35-44 Correlation Summary
| Measurement | Immigrants from Guyana | Arapaho |
| Minimum | 68.4% | 48.6% |
| Maximum | 100.0% | 100.0% |
| Range | 31.6% | 51.4% |
| Mean | 85.0% | 72.4% |
| Median | 84.8% | 74.3% |
| Interquartile 25% (IQ1) | 82.5% | 61.4% |
| Interquartile 75% (IQ3) | 87.2% | 81.5% |
| Interquartile Range (IQR) | 4.6% | 20.1% |
| Standard Deviation (Sample) | 5.7% | 12.6% |
| Standard Deviation (Population) | 5.7% | 12.3% |
Similar Demographics by In Labor Force | Age 35-44
Demographics Similar to Immigrants from Guyana by In Labor Force | Age 35-44
In terms of in labor force | age 35-44, the demographic groups most similar to Immigrants from Guyana are Salvadoran (83.6%, a difference of 0.0%), Lebanese (83.6%, a difference of 0.0%), Tongan (83.6%, a difference of 0.010%), White/Caucasian (83.6%, a difference of 0.020%), and Immigrants from the Azores (83.6%, a difference of 0.040%).
| Demographics | Rating | Rank | In Labor Force | Age 35-44 |
| Malaysians | 1.1 /100 | #245 | Tragic 83.8% |
| Immigrants | Immigrants | 1.0 /100 | #246 | Tragic 83.7% |
| Immigrants | Armenia | 0.9 /100 | #247 | Tragic 83.7% |
| Indonesians | 0.8 /100 | #248 | Tragic 83.7% |
| Immigrants | St. Vincent and the Grenadines | 0.7 /100 | #249 | Tragic 83.7% |
| Whites/Caucasians | 0.5 /100 | #250 | Tragic 83.6% |
| Salvadorans | 0.4 /100 | #251 | Tragic 83.6% |
| Immigrants | Guyana | 0.4 /100 | #252 | Tragic 83.6% |
| Lebanese | 0.4 /100 | #253 | Tragic 83.6% |
| Tongans | 0.4 /100 | #254 | Tragic 83.6% |
| Immigrants | Azores | 0.3 /100 | #255 | Tragic 83.6% |
| Japanese | 0.3 /100 | #256 | Tragic 83.6% |
| Basques | 0.3 /100 | #257 | Tragic 83.6% |
| Tsimshian | 0.2 /100 | #258 | Tragic 83.5% |
| Immigrants | El Salvador | 0.2 /100 | #259 | Tragic 83.5% |
Demographics Similar to Arapaho by In Labor Force | Age 35-44
In terms of in labor force | age 35-44, the demographic groups most similar to Arapaho are Apache (77.9%, a difference of 0.21%), Pueblo (77.4%, a difference of 0.91%), Yup'ik (77.3%, a difference of 1.0%), Native/Alaskan (78.9%, a difference of 1.0%), and Yakama (79.0%, a difference of 1.1%).
| Demographics | Rating | Rank | In Labor Force | Age 35-44 |
| Menominee | 0.0 /100 | #329 | Tragic 79.7% |
| Cheyenne | 0.0 /100 | #330 | Tragic 79.5% |
| Houma | 0.0 /100 | #331 | Tragic 79.5% |
| Ute | 0.0 /100 | #332 | Tragic 79.4% |
| Kiowa | 0.0 /100 | #333 | Tragic 79.2% |
| Yakama | 0.0 /100 | #334 | Tragic 79.0% |
| Natives/Alaskans | 0.0 /100 | #335 | Tragic 78.9% |
| Arapaho | 0.0 /100 | #336 | Tragic 78.1% |
| Apache | 0.0 /100 | #337 | Tragic 77.9% |
| Pueblo | 0.0 /100 | #338 | Tragic 77.4% |
| Yup'ik | 0.0 /100 | #339 | Tragic 77.3% |
| Lumbee | 0.0 /100 | #340 | Tragic 77.0% |
| Hopi | 0.0 /100 | #341 | Tragic 77.0% |
| Crow | 0.0 /100 | #342 | Tragic 76.5% |
| Immigrants | Yemen | 0.0 /100 | #343 | Tragic 76.3% |