Immigrants from Panama vs Canadian In Labor Force | Age 35-44
COMPARE
Immigrants from Panama
Canadian
In Labor Force | Age 35-44
In Labor Force | Age 35-44 Comparison
Immigrants from Panama
Canadians
84.0%
IN LABOR FORCE | AGE 35-44
6.4/ 100
METRIC RATING
223rd/ 347
METRIC RANK
84.2%
IN LABOR FORCE | AGE 35-44
19.9/ 100
METRIC RATING
204th/ 347
METRIC RANK
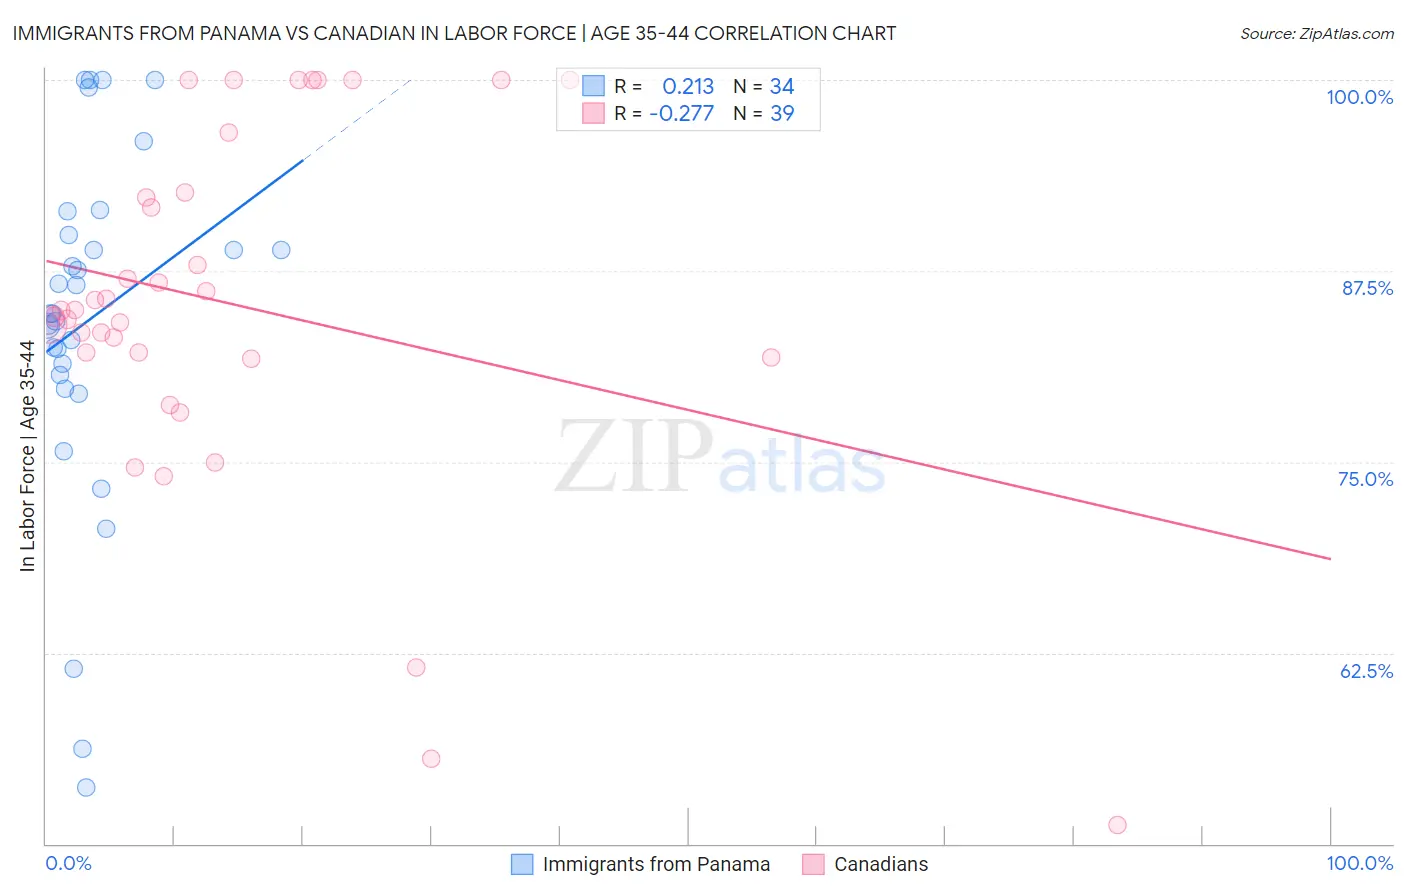
Immigrants from Panama vs Canadian In Labor Force | Age 35-44 Correlation Chart
The statistical analysis conducted on geographies consisting of 221,162,484 people shows a weak positive correlation between the proportion of Immigrants from Panama and labor force participation rate among population between the ages 35 and 44 in the United States with a correlation coefficient (R) of 0.213 and weighted average of 84.0%. Similarly, the statistical analysis conducted on geographies consisting of 437,310,598 people shows a weak negative correlation between the proportion of Canadians and labor force participation rate among population between the ages 35 and 44 in the United States with a correlation coefficient (R) of -0.277 and weighted average of 84.2%, a difference of 0.21%.
In Labor Force | Age 35-44 Correlation Summary
| Measurement | Immigrants from Panama | Canadian |
| Minimum | 53.7% | 51.2% |
| Maximum | 100.0% | 100.0% |
| Range | 46.3% | 48.8% |
| Mean | 84.3% | 85.3% |
| Median | 84.7% | 84.9% |
| Interquartile 25% (IQ1) | 80.7% | 81.8% |
| Interquartile 75% (IQ3) | 89.8% | 92.7% |
| Interquartile Range (IQR) | 9.2% | 10.9% |
| Standard Deviation (Sample) | 11.4% | 11.6% |
| Standard Deviation (Population) | 11.2% | 11.5% |
Demographics Similar to Immigrants from Panama and Canadians by In Labor Force | Age 35-44
In terms of in labor force | age 35-44, the demographic groups most similar to Immigrants from Panama are Assyrian/Chaldean/Syriac (84.0%, a difference of 0.0%), Icelander (84.0%, a difference of 0.010%), French (84.0%, a difference of 0.030%), Immigrants from Nicaragua (84.1%, a difference of 0.070%), and Subsaharan African (84.1%, a difference of 0.070%). Similarly, the demographic groups most similar to Canadians are Immigrants from Canada (84.2%, a difference of 0.0%), Immigrants from Costa Rica (84.2%, a difference of 0.0%), Laotian (84.2%, a difference of 0.010%), Immigrants from South Eastern Asia (84.2%, a difference of 0.020%), and Immigrants from North America (84.2%, a difference of 0.020%).
| Demographics | Rating | Rank | In Labor Force | Age 35-44 |
| Immigrants | South Eastern Asia | 22.4 /100 | #203 | Fair 84.2% |
| Canadians | 19.9 /100 | #204 | Poor 84.2% |
| Immigrants | Canada | 19.6 /100 | #205 | Poor 84.2% |
| Immigrants | Costa Rica | 19.5 /100 | #206 | Poor 84.2% |
| Laotians | 19.0 /100 | #207 | Poor 84.2% |
| Immigrants | North America | 18.1 /100 | #208 | Poor 84.2% |
| Swiss | 17.4 /100 | #209 | Poor 84.2% |
| New Zealanders | 16.2 /100 | #210 | Poor 84.1% |
| Immigrants | Ecuador | 15.2 /100 | #211 | Poor 84.1% |
| Israelis | 14.0 /100 | #212 | Poor 84.1% |
| Bangladeshis | 13.7 /100 | #213 | Poor 84.1% |
| Immigrants | Barbados | 13.2 /100 | #214 | Poor 84.1% |
| Europeans | 12.2 /100 | #215 | Poor 84.1% |
| Nicaraguans | 12.1 /100 | #216 | Poor 84.1% |
| Immigrants | Norway | 11.7 /100 | #217 | Poor 84.1% |
| Immigrants | Nicaragua | 9.4 /100 | #218 | Tragic 84.1% |
| Sub-Saharan Africans | 9.3 /100 | #219 | Tragic 84.1% |
| French | 7.5 /100 | #220 | Tragic 84.0% |
| Icelanders | 6.7 /100 | #221 | Tragic 84.0% |
| Assyrians/Chaldeans/Syriacs | 6.6 /100 | #222 | Tragic 84.0% |
| Immigrants | Panama | 6.4 /100 | #223 | Tragic 84.0% |