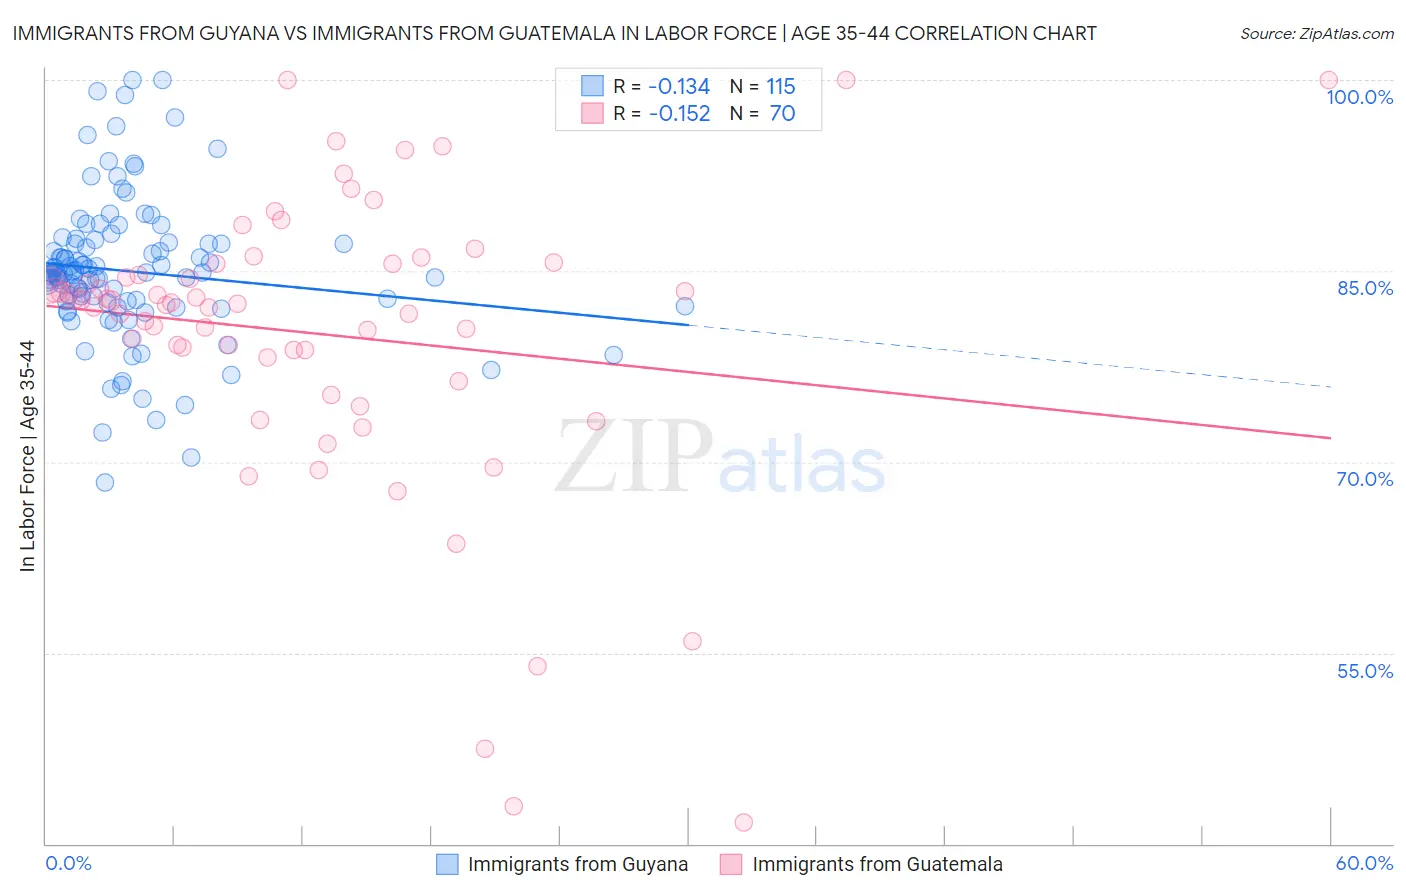
Immigrants from Guyana vs Immigrants from Guatemala In Labor Force | Age 35-44
COMPARE
Immigrants from Guyana
Immigrants from Guatemala
In Labor Force | Age 35-44
In Labor Force | Age 35-44 Comparison
Immigrants from Guyana
Immigrants from Guatemala
83.6%
IN LABOR FORCE | AGE 35-44
0.4/ 100
METRIC RATING
252nd/ 347
METRIC RANK
82.9%
IN LABOR FORCE | AGE 35-44
0.0/ 100
METRIC RATING
283rd/ 347
METRIC RANK
Immigrants from Guyana vs Immigrants from Guatemala In Labor Force | Age 35-44 Correlation Chart
The statistical analysis conducted on geographies consisting of 183,700,489 people shows a poor negative correlation between the proportion of Immigrants from Guyana and labor force participation rate among population between the ages 35 and 44 in the United States with a correlation coefficient (R) of -0.134 and weighted average of 83.6%. Similarly, the statistical analysis conducted on geographies consisting of 377,183,451 people shows a poor negative correlation between the proportion of Immigrants from Guatemala and labor force participation rate among population between the ages 35 and 44 in the United States with a correlation coefficient (R) of -0.152 and weighted average of 82.9%, a difference of 0.82%.
In Labor Force | Age 35-44 Correlation Summary
| Measurement | Immigrants from Guyana | Immigrants from Guatemala |
| Minimum | 68.4% | 41.7% |
| Maximum | 100.0% | 100.0% |
| Range | 31.6% | 58.3% |
| Mean | 85.0% | 80.1% |
| Median | 84.8% | 82.5% |
| Interquartile 25% (IQ1) | 82.5% | 78.2% |
| Interquartile 75% (IQ3) | 87.2% | 85.5% |
| Interquartile Range (IQR) | 4.6% | 7.3% |
| Standard Deviation (Sample) | 5.7% | 11.5% |
| Standard Deviation (Population) | 5.7% | 11.5% |
Similar Demographics by In Labor Force | Age 35-44
Demographics Similar to Immigrants from Guyana by In Labor Force | Age 35-44
In terms of in labor force | age 35-44, the demographic groups most similar to Immigrants from Guyana are Salvadoran (83.6%, a difference of 0.0%), Lebanese (83.6%, a difference of 0.0%), Tongan (83.6%, a difference of 0.010%), White/Caucasian (83.6%, a difference of 0.020%), and Immigrants from the Azores (83.6%, a difference of 0.040%).
| Demographics | Rating | Rank | In Labor Force | Age 35-44 |
| Malaysians | 1.1 /100 | #245 | Tragic 83.8% |
| Immigrants | Immigrants | 1.0 /100 | #246 | Tragic 83.7% |
| Immigrants | Armenia | 0.9 /100 | #247 | Tragic 83.7% |
| Indonesians | 0.8 /100 | #248 | Tragic 83.7% |
| Immigrants | St. Vincent and the Grenadines | 0.7 /100 | #249 | Tragic 83.7% |
| Whites/Caucasians | 0.5 /100 | #250 | Tragic 83.6% |
| Salvadorans | 0.4 /100 | #251 | Tragic 83.6% |
| Immigrants | Guyana | 0.4 /100 | #252 | Tragic 83.6% |
| Lebanese | 0.4 /100 | #253 | Tragic 83.6% |
| Tongans | 0.4 /100 | #254 | Tragic 83.6% |
| Immigrants | Azores | 0.3 /100 | #255 | Tragic 83.6% |
| Japanese | 0.3 /100 | #256 | Tragic 83.6% |
| Basques | 0.3 /100 | #257 | Tragic 83.6% |
| Tsimshian | 0.2 /100 | #258 | Tragic 83.5% |
| Immigrants | El Salvador | 0.2 /100 | #259 | Tragic 83.5% |
Demographics Similar to Immigrants from Guatemala by In Labor Force | Age 35-44
In terms of in labor force | age 35-44, the demographic groups most similar to Immigrants from Guatemala are Osage (82.9%, a difference of 0.0%), Immigrants from Dominican Republic (82.9%, a difference of 0.010%), Fijian (82.9%, a difference of 0.020%), Immigrants from Bangladesh (82.9%, a difference of 0.020%), and Immigrants from Belize (82.9%, a difference of 0.030%).
| Demographics | Rating | Rank | In Labor Force | Age 35-44 |
| Delaware | 0.0 /100 | #276 | Tragic 83.2% |
| Samoans | 0.0 /100 | #277 | Tragic 83.2% |
| Belizeans | 0.0 /100 | #278 | Tragic 83.1% |
| Immigrants | Micronesia | 0.0 /100 | #279 | Tragic 83.1% |
| Dominicans | 0.0 /100 | #280 | Tragic 83.1% |
| Guatemalans | 0.0 /100 | #281 | Tragic 83.0% |
| Osage | 0.0 /100 | #282 | Tragic 82.9% |
| Immigrants | Guatemala | 0.0 /100 | #283 | Tragic 82.9% |
| Immigrants | Dominican Republic | 0.0 /100 | #284 | Tragic 82.9% |
| Fijians | 0.0 /100 | #285 | Tragic 82.9% |
| Immigrants | Bangladesh | 0.0 /100 | #286 | Tragic 82.9% |
| Immigrants | Belize | 0.0 /100 | #287 | Tragic 82.9% |
| Puget Sound Salish | 0.0 /100 | #288 | Tragic 82.9% |
| Chippewa | 0.0 /100 | #289 | Tragic 82.9% |
| Africans | 0.0 /100 | #290 | Tragic 82.9% |