Immigrants from Guyana vs Canadian Unemployment Among Youth under 25 years
COMPARE
Immigrants from Guyana
Canadian
Unemployment Among Youth under 25 years
Unemployment Among Youth under 25 years Comparison
Immigrants from Guyana
Canadians
15.9%
UNEMPLOYMENT AMONG YOUTH UNDER 25 YEARS
0.0/ 100
METRIC RATING
334th/ 347
METRIC RANK
11.4%
UNEMPLOYMENT AMONG YOUTH UNDER 25 YEARS
86.6/ 100
METRIC RATING
126th/ 347
METRIC RANK
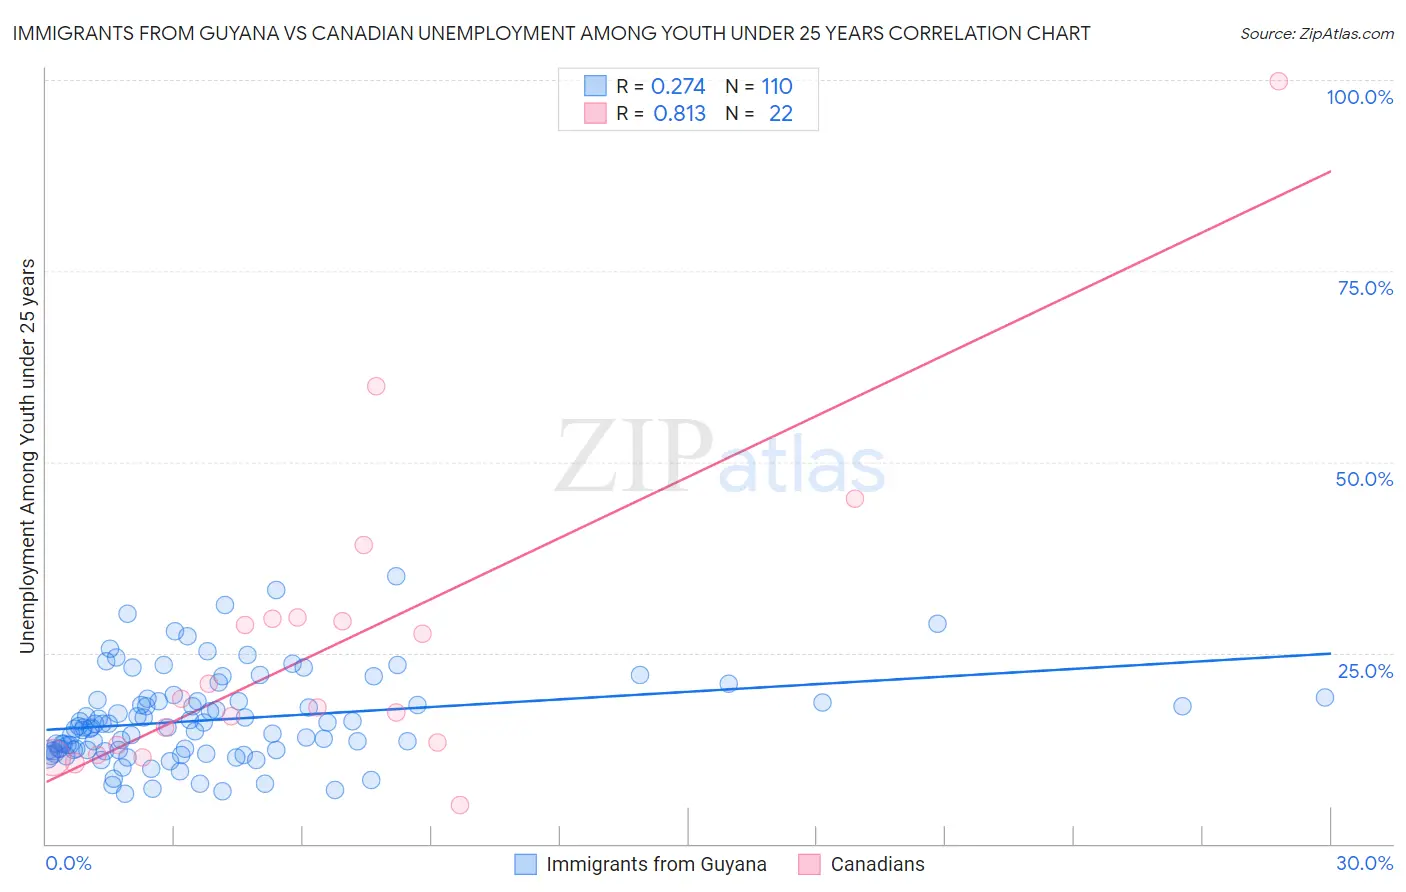
Immigrants from Guyana vs Canadian Unemployment Among Youth under 25 years Correlation Chart
The statistical analysis conducted on geographies consisting of 182,851,664 people shows a weak positive correlation between the proportion of Immigrants from Guyana and unemployment rate among youth under the age of 25 in the United States with a correlation coefficient (R) of 0.274 and weighted average of 15.9%. Similarly, the statistical analysis conducted on geographies consisting of 429,272,443 people shows a very strong positive correlation between the proportion of Canadians and unemployment rate among youth under the age of 25 in the United States with a correlation coefficient (R) of 0.813 and weighted average of 11.4%, a difference of 40.0%.
Unemployment Among Youth under 25 years Correlation Summary
| Measurement | Immigrants from Guyana | Canadian |
| Minimum | 6.6% | 5.0% |
| Maximum | 35.1% | 99.9% |
| Range | 28.5% | 94.9% |
| Mean | 16.2% | 26.0% |
| Median | 15.3% | 18.4% |
| Interquartile 25% (IQ1) | 12.3% | 13.0% |
| Interquartile 75% (IQ3) | 18.7% | 29.4% |
| Interquartile Range (IQR) | 6.4% | 16.5% |
| Standard Deviation (Sample) | 5.8% | 21.0% |
| Standard Deviation (Population) | 5.8% | 20.5% |
Similar Demographics by Unemployment Among Youth under 25 years
Demographics Similar to Immigrants from Guyana by Unemployment Among Youth under 25 years
In terms of unemployment among youth under 25 years, the demographic groups most similar to Immigrants from Guyana are Guyanese (15.9%, a difference of 0.25%), Immigrants from Grenada (15.8%, a difference of 0.71%), Immigrants from St. Vincent and the Grenadines (16.1%, a difference of 1.3%), Dominican (15.7%, a difference of 1.4%), and Pima (16.2%, a difference of 1.9%).
| Demographics | Rating | Rank | Unemployment Among Youth under 25 years |
| British West Indians | 0.0 /100 | #327 | Tragic 15.5% |
| Immigrants | Dominican Republic | 0.0 /100 | #328 | Tragic 15.6% |
| Immigrants | Yemen | 0.0 /100 | #329 | Tragic 15.6% |
| Yakama | 0.0 /100 | #330 | Tragic 15.6% |
| Dominicans | 0.0 /100 | #331 | Tragic 15.7% |
| Immigrants | Grenada | 0.0 /100 | #332 | Tragic 15.8% |
| Guyanese | 0.0 /100 | #333 | Tragic 15.9% |
| Immigrants | Guyana | 0.0 /100 | #334 | Tragic 15.9% |
| Immigrants | St. Vincent and the Grenadines | 0.0 /100 | #335 | Tragic 16.1% |
| Pima | 0.0 /100 | #336 | Tragic 16.2% |
| Arapaho | 0.0 /100 | #337 | Tragic 16.3% |
| Yuman | 0.0 /100 | #338 | Tragic 16.3% |
| Tsimshian | 0.0 /100 | #339 | Tragic 16.5% |
| Colville | 0.0 /100 | #340 | Tragic 16.8% |
| Paiute | 0.0 /100 | #341 | Tragic 17.6% |
Demographics Similar to Canadians by Unemployment Among Youth under 25 years
In terms of unemployment among youth under 25 years, the demographic groups most similar to Canadians are Greek (11.4%, a difference of 0.040%), Italian (11.4%, a difference of 0.050%), Immigrants from Argentina (11.4%, a difference of 0.050%), Immigrants from Hungary (11.4%, a difference of 0.050%), and Turkish (11.4%, a difference of 0.070%).
| Demographics | Rating | Rank | Unemployment Among Youth under 25 years |
| Immigrants | Scotland | 89.2 /100 | #119 | Excellent 11.4% |
| Malaysians | 89.0 /100 | #120 | Excellent 11.4% |
| Slovaks | 88.9 /100 | #121 | Excellent 11.4% |
| Immigrants | Micronesia | 88.1 /100 | #122 | Excellent 11.4% |
| Basques | 87.8 /100 | #123 | Excellent 11.4% |
| Italians | 87.2 /100 | #124 | Excellent 11.4% |
| Immigrants | Argentina | 87.2 /100 | #125 | Excellent 11.4% |
| Canadians | 86.6 /100 | #126 | Excellent 11.4% |
| Greeks | 86.2 /100 | #127 | Excellent 11.4% |
| Immigrants | Hungary | 86.0 /100 | #128 | Excellent 11.4% |
| Turks | 85.8 /100 | #129 | Excellent 11.4% |
| Hungarians | 85.7 /100 | #130 | Excellent 11.4% |
| Immigrants | Spain | 84.6 /100 | #131 | Excellent 11.4% |
| Ethiopians | 83.2 /100 | #132 | Excellent 11.4% |
| Lebanese | 83.1 /100 | #133 | Excellent 11.4% |