Colville vs Canadian In Labor Force | Age 35-44
COMPARE
Colville
Canadian
In Labor Force | Age 35-44
In Labor Force | Age 35-44 Comparison
Colville
Canadians
81.7%
IN LABOR FORCE | AGE 35-44
0.0/ 100
METRIC RATING
311th/ 347
METRIC RANK
84.2%
IN LABOR FORCE | AGE 35-44
19.9/ 100
METRIC RATING
204th/ 347
METRIC RANK
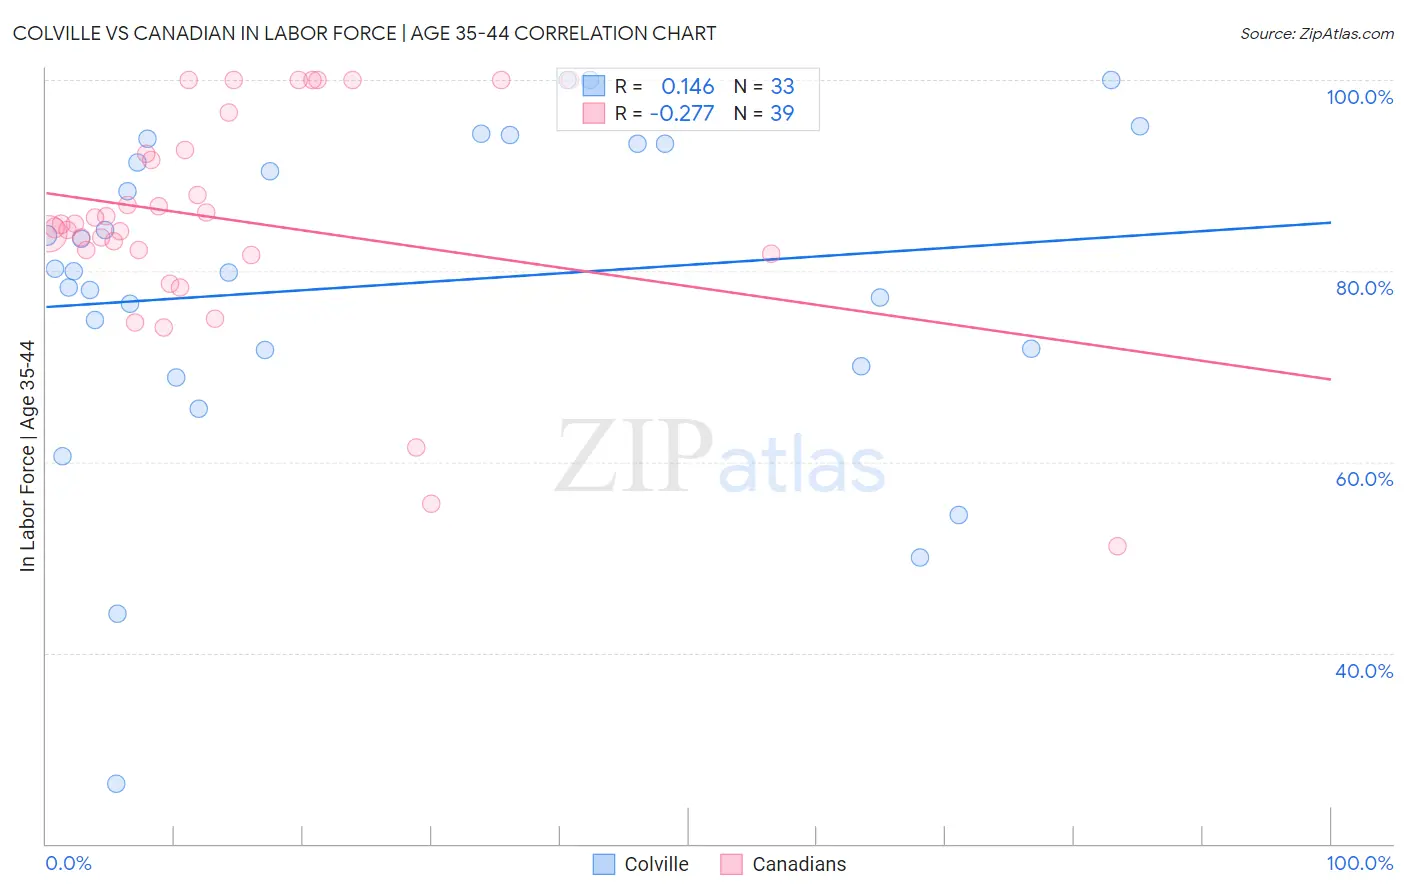
Colville vs Canadian In Labor Force | Age 35-44 Correlation Chart
The statistical analysis conducted on geographies consisting of 34,682,533 people shows a poor positive correlation between the proportion of Colville and labor force participation rate among population between the ages 35 and 44 in the United States with a correlation coefficient (R) of 0.146 and weighted average of 81.7%. Similarly, the statistical analysis conducted on geographies consisting of 437,310,598 people shows a weak negative correlation between the proportion of Canadians and labor force participation rate among population between the ages 35 and 44 in the United States with a correlation coefficient (R) of -0.277 and weighted average of 84.2%, a difference of 3.0%.
In Labor Force | Age 35-44 Correlation Summary
| Measurement | Colville | Canadian |
| Minimum | 26.3% | 51.2% |
| Maximum | 100.0% | 100.0% |
| Range | 73.7% | 48.8% |
| Mean | 78.6% | 85.3% |
| Median | 79.9% | 84.9% |
| Interquartile 25% (IQ1) | 70.8% | 81.8% |
| Interquartile 75% (IQ3) | 93.3% | 92.7% |
| Interquartile Range (IQR) | 22.5% | 10.9% |
| Standard Deviation (Sample) | 17.1% | 11.6% |
| Standard Deviation (Population) | 16.9% | 11.5% |
Similar Demographics by In Labor Force | Age 35-44
Demographics Similar to Colville by In Labor Force | Age 35-44
In terms of in labor force | age 35-44, the demographic groups most similar to Colville are Alaska Native (81.6%, a difference of 0.14%), Mexican (81.6%, a difference of 0.15%), Blackfeet (81.9%, a difference of 0.17%), Cajun (81.5%, a difference of 0.26%), and Immigrants from Mexico (81.5%, a difference of 0.28%).
| Demographics | Rating | Rank | In Labor Force | Age 35-44 |
| Marshallese | 0.0 /100 | #304 | Tragic 82.4% |
| Shoshone | 0.0 /100 | #305 | Tragic 82.2% |
| Blacks/African Americans | 0.0 /100 | #306 | Tragic 82.2% |
| Hispanics or Latinos | 0.0 /100 | #307 | Tragic 82.1% |
| Immigrants | Central America | 0.0 /100 | #308 | Tragic 82.0% |
| Cree | 0.0 /100 | #309 | Tragic 82.0% |
| Blackfeet | 0.0 /100 | #310 | Tragic 81.9% |
| Colville | 0.0 /100 | #311 | Tragic 81.7% |
| Alaska Natives | 0.0 /100 | #312 | Tragic 81.6% |
| Mexicans | 0.0 /100 | #313 | Tragic 81.6% |
| Cajuns | 0.0 /100 | #314 | Tragic 81.5% |
| Immigrants | Mexico | 0.0 /100 | #315 | Tragic 81.5% |
| Comanche | 0.0 /100 | #316 | Tragic 81.5% |
| Cherokee | 0.0 /100 | #317 | Tragic 81.4% |
| Alaskan Athabascans | 0.0 /100 | #318 | Tragic 81.3% |
Demographics Similar to Canadians by In Labor Force | Age 35-44
In terms of in labor force | age 35-44, the demographic groups most similar to Canadians are Immigrants from Canada (84.2%, a difference of 0.0%), Immigrants from Costa Rica (84.2%, a difference of 0.0%), Laotian (84.2%, a difference of 0.010%), Immigrants from South Eastern Asia (84.2%, a difference of 0.020%), and Immigrants from North America (84.2%, a difference of 0.020%).
| Demographics | Rating | Rank | In Labor Force | Age 35-44 |
| Immigrants | Western Europe | 24.7 /100 | #197 | Fair 84.2% |
| Ecuadorians | 24.0 /100 | #198 | Fair 84.2% |
| Syrians | 23.2 /100 | #199 | Fair 84.2% |
| Moroccans | 23.2 /100 | #200 | Fair 84.2% |
| British | 23.0 /100 | #201 | Fair 84.2% |
| Immigrants | Uzbekistan | 22.8 /100 | #202 | Fair 84.2% |
| Immigrants | South Eastern Asia | 22.4 /100 | #203 | Fair 84.2% |
| Canadians | 19.9 /100 | #204 | Poor 84.2% |
| Immigrants | Canada | 19.6 /100 | #205 | Poor 84.2% |
| Immigrants | Costa Rica | 19.5 /100 | #206 | Poor 84.2% |
| Laotians | 19.0 /100 | #207 | Poor 84.2% |
| Immigrants | North America | 18.1 /100 | #208 | Poor 84.2% |
| Swiss | 17.4 /100 | #209 | Poor 84.2% |
| New Zealanders | 16.2 /100 | #210 | Poor 84.1% |
| Immigrants | Ecuador | 15.2 /100 | #211 | Poor 84.1% |