French vs Arapaho In Labor Force | Age 35-44
COMPARE
French
Arapaho
In Labor Force | Age 35-44
In Labor Force | Age 35-44 Comparison
French
Arapaho
84.0%
IN LABOR FORCE | AGE 35-44
7.5/ 100
METRIC RATING
220th/ 347
METRIC RANK
78.1%
IN LABOR FORCE | AGE 35-44
0.0/ 100
METRIC RATING
336th/ 347
METRIC RANK
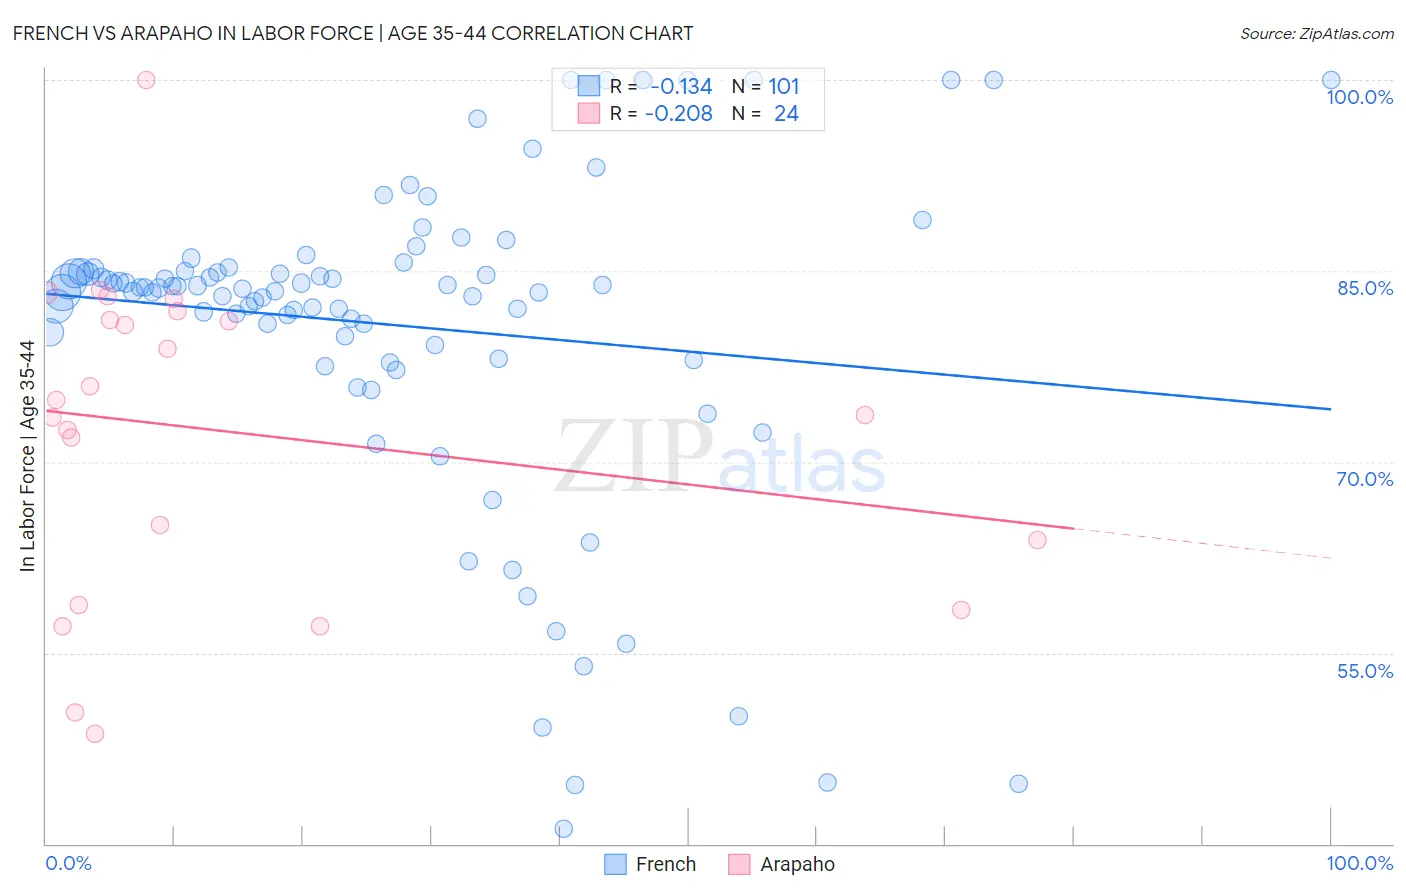
French vs Arapaho In Labor Force | Age 35-44 Correlation Chart
The statistical analysis conducted on geographies consisting of 571,709,167 people shows a poor negative correlation between the proportion of French and labor force participation rate among population between the ages 35 and 44 in the United States with a correlation coefficient (R) of -0.134 and weighted average of 84.0%. Similarly, the statistical analysis conducted on geographies consisting of 29,776,637 people shows a weak negative correlation between the proportion of Arapaho and labor force participation rate among population between the ages 35 and 44 in the United States with a correlation coefficient (R) of -0.208 and weighted average of 78.1%, a difference of 7.6%.
In Labor Force | Age 35-44 Correlation Summary
| Measurement | French | Arapaho |
| Minimum | 41.2% | 48.6% |
| Maximum | 100.0% | 100.0% |
| Range | 58.8% | 51.4% |
| Mean | 80.7% | 72.4% |
| Median | 83.7% | 74.3% |
| Interquartile 25% (IQ1) | 78.6% | 61.4% |
| Interquartile 75% (IQ3) | 85.1% | 81.5% |
| Interquartile Range (IQR) | 6.4% | 20.1% |
| Standard Deviation (Sample) | 12.8% | 12.6% |
| Standard Deviation (Population) | 12.8% | 12.3% |
Similar Demographics by In Labor Force | Age 35-44
Demographics Similar to French by In Labor Force | Age 35-44
In terms of in labor force | age 35-44, the demographic groups most similar to French are Icelander (84.0%, a difference of 0.020%), Assyrian/Chaldean/Syriac (84.0%, a difference of 0.020%), Immigrants from Panama (84.0%, a difference of 0.030%), Immigrants from Nicaragua (84.1%, a difference of 0.040%), and Subsaharan African (84.1%, a difference of 0.040%).
| Demographics | Rating | Rank | In Labor Force | Age 35-44 |
| Bangladeshis | 13.7 /100 | #213 | Poor 84.1% |
| Immigrants | Barbados | 13.2 /100 | #214 | Poor 84.1% |
| Europeans | 12.2 /100 | #215 | Poor 84.1% |
| Nicaraguans | 12.1 /100 | #216 | Poor 84.1% |
| Immigrants | Norway | 11.7 /100 | #217 | Poor 84.1% |
| Immigrants | Nicaragua | 9.4 /100 | #218 | Tragic 84.1% |
| Sub-Saharan Africans | 9.3 /100 | #219 | Tragic 84.1% |
| French | 7.5 /100 | #220 | Tragic 84.0% |
| Icelanders | 6.7 /100 | #221 | Tragic 84.0% |
| Assyrians/Chaldeans/Syriacs | 6.6 /100 | #222 | Tragic 84.0% |
| Immigrants | Panama | 6.4 /100 | #223 | Tragic 84.0% |
| U.S. Virgin Islanders | 6.1 /100 | #224 | Tragic 84.0% |
| Immigrants | Burma/Myanmar | 6.1 /100 | #225 | Tragic 84.0% |
| Panamanians | 5.4 /100 | #226 | Tragic 84.0% |
| British West Indians | 5.3 /100 | #227 | Tragic 84.0% |
Demographics Similar to Arapaho by In Labor Force | Age 35-44
In terms of in labor force | age 35-44, the demographic groups most similar to Arapaho are Apache (77.9%, a difference of 0.21%), Pueblo (77.4%, a difference of 0.91%), Yup'ik (77.3%, a difference of 1.0%), Native/Alaskan (78.9%, a difference of 1.0%), and Yakama (79.0%, a difference of 1.1%).
| Demographics | Rating | Rank | In Labor Force | Age 35-44 |
| Menominee | 0.0 /100 | #329 | Tragic 79.7% |
| Cheyenne | 0.0 /100 | #330 | Tragic 79.5% |
| Houma | 0.0 /100 | #331 | Tragic 79.5% |
| Ute | 0.0 /100 | #332 | Tragic 79.4% |
| Kiowa | 0.0 /100 | #333 | Tragic 79.2% |
| Yakama | 0.0 /100 | #334 | Tragic 79.0% |
| Natives/Alaskans | 0.0 /100 | #335 | Tragic 78.9% |
| Arapaho | 0.0 /100 | #336 | Tragic 78.1% |
| Apache | 0.0 /100 | #337 | Tragic 77.9% |
| Pueblo | 0.0 /100 | #338 | Tragic 77.4% |
| Yup'ik | 0.0 /100 | #339 | Tragic 77.3% |
| Lumbee | 0.0 /100 | #340 | Tragic 77.0% |
| Hopi | 0.0 /100 | #341 | Tragic 77.0% |
| Crow | 0.0 /100 | #342 | Tragic 76.5% |
| Immigrants | Yemen | 0.0 /100 | #343 | Tragic 76.3% |