Hopi vs Arapaho In Labor Force | Age 35-44
COMPARE
Hopi
Arapaho
In Labor Force | Age 35-44
In Labor Force | Age 35-44 Comparison
Hopi
Arapaho
77.0%
IN LABOR FORCE | AGE 35-44
0.0/ 100
METRIC RATING
341st/ 347
METRIC RANK
78.1%
IN LABOR FORCE | AGE 35-44
0.0/ 100
METRIC RATING
336th/ 347
METRIC RANK
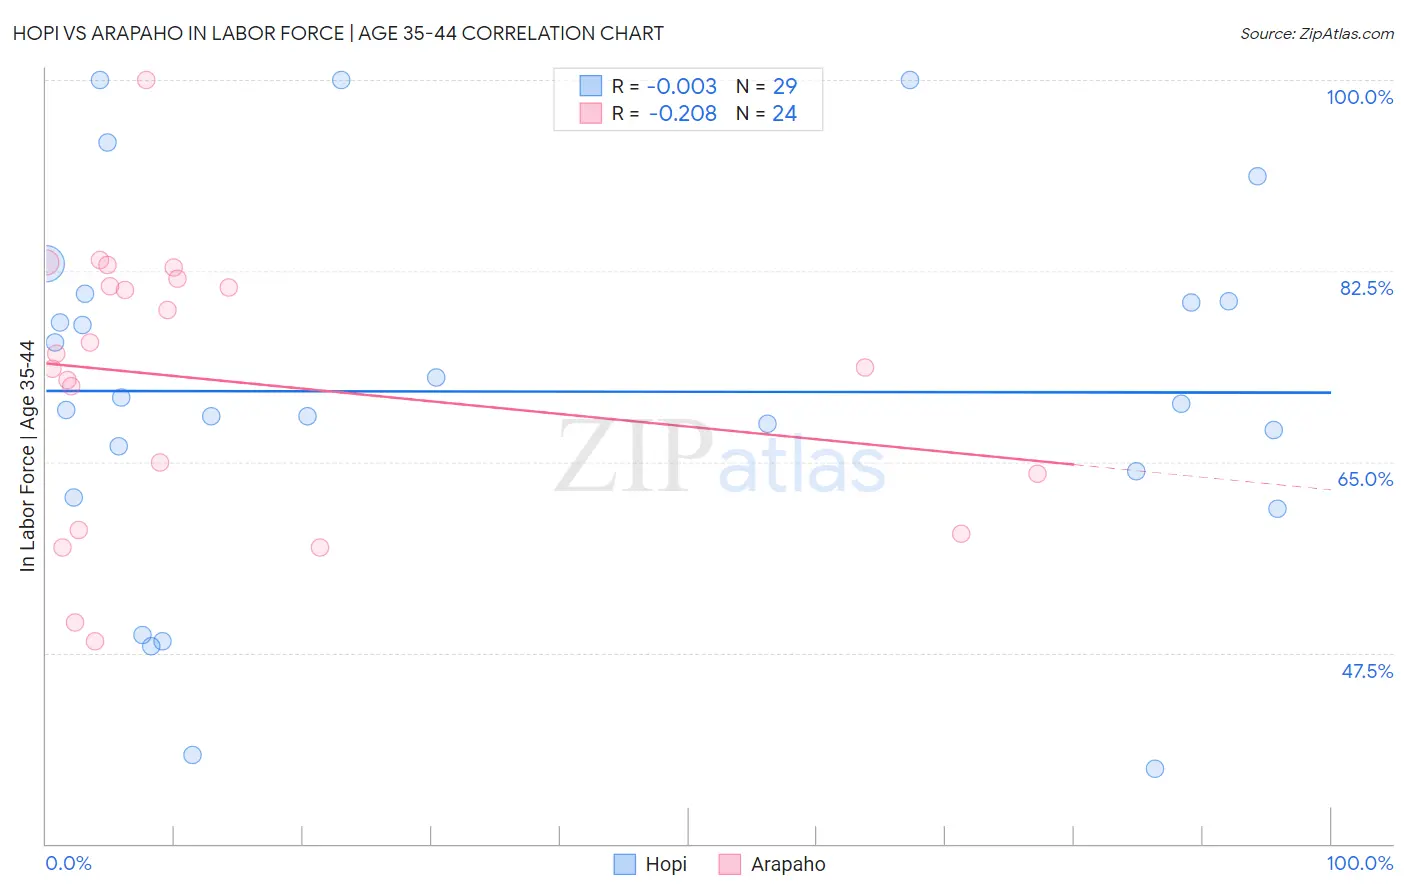
Hopi vs Arapaho In Labor Force | Age 35-44 Correlation Chart
The statistical analysis conducted on geographies consisting of 74,733,485 people shows no correlation between the proportion of Hopi and labor force participation rate among population between the ages 35 and 44 in the United States with a correlation coefficient (R) of -0.003 and weighted average of 77.0%. Similarly, the statistical analysis conducted on geographies consisting of 29,776,637 people shows a weak negative correlation between the proportion of Arapaho and labor force participation rate among population between the ages 35 and 44 in the United States with a correlation coefficient (R) of -0.208 and weighted average of 78.1%, a difference of 1.4%.
In Labor Force | Age 35-44 Correlation Summary
| Measurement | Hopi | Arapaho |
| Minimum | 36.9% | 48.6% |
| Maximum | 100.0% | 100.0% |
| Range | 63.1% | 51.4% |
| Mean | 71.4% | 72.4% |
| Median | 70.3% | 74.3% |
| Interquartile 25% (IQ1) | 62.9% | 61.4% |
| Interquartile 75% (IQ3) | 80.1% | 81.5% |
| Interquartile Range (IQR) | 17.1% | 20.1% |
| Standard Deviation (Sample) | 16.9% | 12.6% |
| Standard Deviation (Population) | 16.6% | 12.3% |
Demographics Similar to Hopi and Arapaho by In Labor Force | Age 35-44
In terms of in labor force | age 35-44, the demographic groups most similar to Hopi are Lumbee (77.0%, a difference of 0.050%), Yup'ik (77.3%, a difference of 0.40%), Pueblo (77.4%, a difference of 0.50%), Crow (76.5%, a difference of 0.64%), and Immigrants from Yemen (76.3%, a difference of 0.88%). Similarly, the demographic groups most similar to Arapaho are Apache (77.9%, a difference of 0.21%), Pueblo (77.4%, a difference of 0.91%), Yup'ik (77.3%, a difference of 1.0%), Native/Alaskan (78.9%, a difference of 1.0%), and Yakama (79.0%, a difference of 1.1%).
| Demographics | Rating | Rank | In Labor Force | Age 35-44 |
| Creek | 0.0 /100 | #328 | Tragic 80.0% |
| Menominee | 0.0 /100 | #329 | Tragic 79.7% |
| Cheyenne | 0.0 /100 | #330 | Tragic 79.5% |
| Houma | 0.0 /100 | #331 | Tragic 79.5% |
| Ute | 0.0 /100 | #332 | Tragic 79.4% |
| Kiowa | 0.0 /100 | #333 | Tragic 79.2% |
| Yakama | 0.0 /100 | #334 | Tragic 79.0% |
| Natives/Alaskans | 0.0 /100 | #335 | Tragic 78.9% |
| Arapaho | 0.0 /100 | #336 | Tragic 78.1% |
| Apache | 0.0 /100 | #337 | Tragic 77.9% |
| Pueblo | 0.0 /100 | #338 | Tragic 77.4% |
| Yup'ik | 0.0 /100 | #339 | Tragic 77.3% |
| Lumbee | 0.0 /100 | #340 | Tragic 77.0% |
| Hopi | 0.0 /100 | #341 | Tragic 77.0% |
| Crow | 0.0 /100 | #342 | Tragic 76.5% |
| Immigrants | Yemen | 0.0 /100 | #343 | Tragic 76.3% |
| Pima | 0.0 /100 | #344 | Tragic 74.8% |
| Yuman | 0.0 /100 | #345 | Tragic 74.7% |
| Tohono O'odham | 0.0 /100 | #346 | Tragic 74.1% |
| Navajo | 0.0 /100 | #347 | Tragic 73.8% |