Immigrants from Guatemala vs Immigrants from Vietnam In Labor Force | Age > 16
COMPARE
Immigrants from Guatemala
Immigrants from Vietnam
In Labor Force | Age > 16
In Labor Force | Age > 16 Comparison
Immigrants from Guatemala
Immigrants from Vietnam
65.6%
IN LABOR FORCE | AGE > 16
94.4/ 100
METRIC RATING
130th/ 347
METRIC RANK
66.2%
IN LABOR FORCE | AGE > 16
99.7/ 100
METRIC RATING
73rd/ 347
METRIC RANK
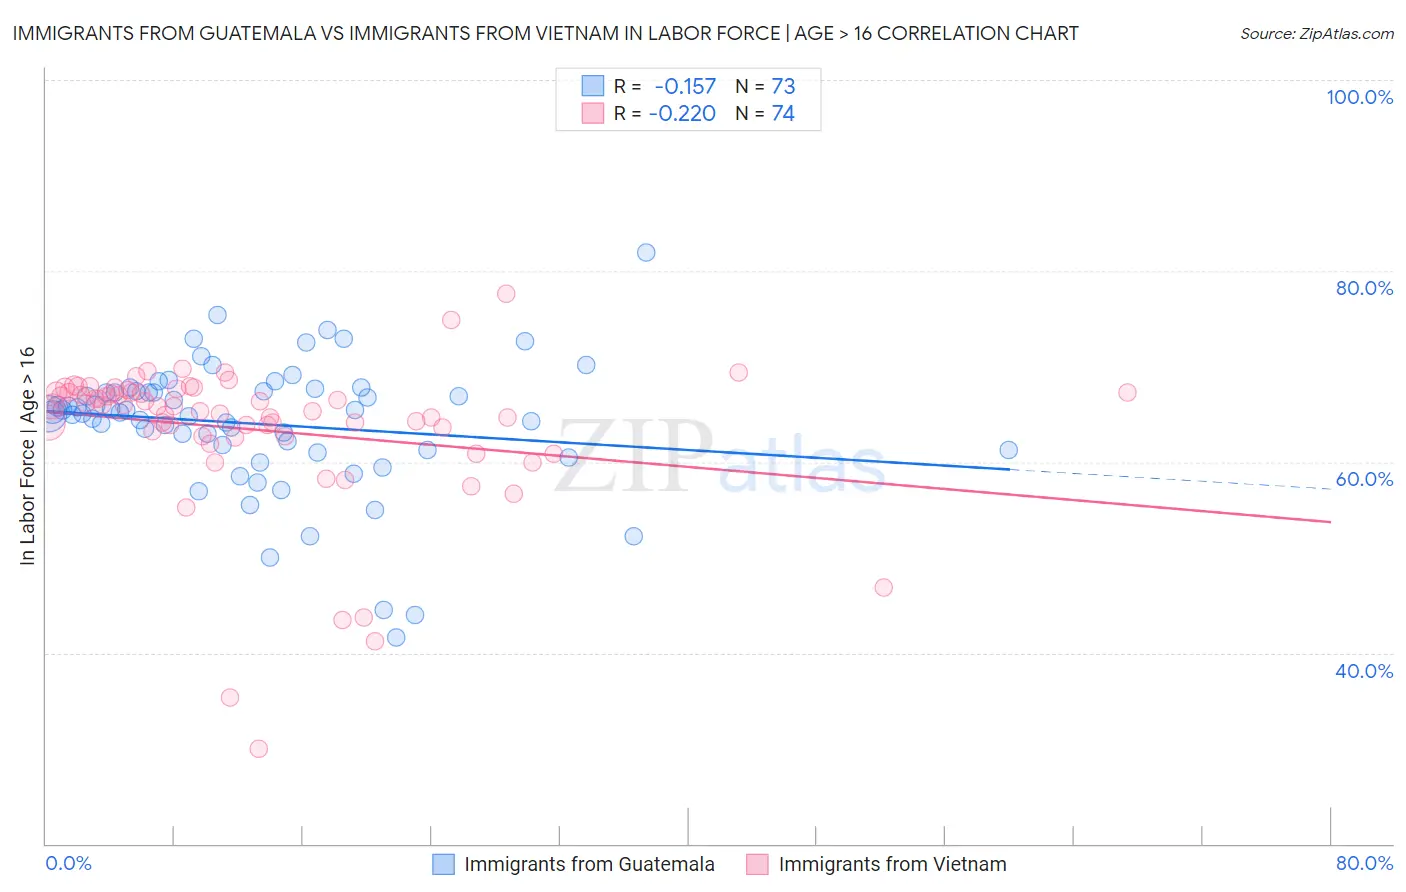
Immigrants from Guatemala vs Immigrants from Vietnam In Labor Force | Age > 16 Correlation Chart
The statistical analysis conducted on geographies consisting of 377,275,426 people shows a poor negative correlation between the proportion of Immigrants from Guatemala and labor force participation rate among population ages 16 and over in the United States with a correlation coefficient (R) of -0.157 and weighted average of 65.6%. Similarly, the statistical analysis conducted on geographies consisting of 404,839,190 people shows a weak negative correlation between the proportion of Immigrants from Vietnam and labor force participation rate among population ages 16 and over in the United States with a correlation coefficient (R) of -0.220 and weighted average of 66.2%, a difference of 0.83%.
In Labor Force | Age > 16 Correlation Summary
| Measurement | Immigrants from Guatemala | Immigrants from Vietnam |
| Minimum | 41.6% | 30.0% |
| Maximum | 81.9% | 77.6% |
| Range | 40.3% | 47.6% |
| Mean | 64.0% | 63.4% |
| Median | 65.1% | 65.8% |
| Interquartile 25% (IQ1) | 61.2% | 62.7% |
| Interquartile 75% (IQ3) | 67.4% | 67.3% |
| Interquartile Range (IQR) | 6.2% | 4.6% |
| Standard Deviation (Sample) | 6.9% | 8.0% |
| Standard Deviation (Population) | 6.8% | 7.9% |
Similar Demographics by In Labor Force | Age > 16
Demographics Similar to Immigrants from Guatemala by In Labor Force | Age > 16
In terms of in labor force | age > 16, the demographic groups most similar to Immigrants from Guatemala are Immigrants from Philippines (65.6%, a difference of 0.0%), Icelander (65.6%, a difference of 0.0%), Immigrants from North Macedonia (65.6%, a difference of 0.010%), Ecuadorian (65.6%, a difference of 0.020%), and Immigrants from Eastern Asia (65.7%, a difference of 0.030%).
| Demographics | Rating | Rank | In Labor Force | Age > 16 |
| Immigrants | Iraq | 95.5 /100 | #123 | Exceptional 65.7% |
| Iraqis | 95.4 /100 | #124 | Exceptional 65.7% |
| Norwegians | 95.3 /100 | #125 | Exceptional 65.7% |
| Koreans | 95.3 /100 | #126 | Exceptional 65.7% |
| Immigrants | Eastern Asia | 94.9 /100 | #127 | Exceptional 65.7% |
| Ecuadorians | 94.7 /100 | #128 | Exceptional 65.6% |
| Immigrants | Philippines | 94.5 /100 | #129 | Exceptional 65.6% |
| Immigrants | Guatemala | 94.4 /100 | #130 | Exceptional 65.6% |
| Icelanders | 94.3 /100 | #131 | Exceptional 65.6% |
| Immigrants | North Macedonia | 94.1 /100 | #132 | Exceptional 65.6% |
| Immigrants | Lithuania | 93.5 /100 | #133 | Exceptional 65.6% |
| Costa Ricans | 93.2 /100 | #134 | Exceptional 65.6% |
| Guatemalans | 92.5 /100 | #135 | Exceptional 65.6% |
| Immigrants | Argentina | 92.4 /100 | #136 | Exceptional 65.6% |
| Guamanians/Chamorros | 92.4 /100 | #137 | Exceptional 65.6% |
Demographics Similar to Immigrants from Vietnam by In Labor Force | Age > 16
In terms of in labor force | age > 16, the demographic groups most similar to Immigrants from Vietnam are Immigrants from Korea (66.2%, a difference of 0.0%), Burmese (66.2%, a difference of 0.010%), Taiwanese (66.2%, a difference of 0.010%), Immigrants from Singapore (66.2%, a difference of 0.010%), and Asian (66.2%, a difference of 0.030%).
| Demographics | Rating | Rank | In Labor Force | Age > 16 |
| Jordanians | 99.8 /100 | #66 | Exceptional 66.3% |
| Egyptians | 99.8 /100 | #67 | Exceptional 66.2% |
| Immigrants | Egypt | 99.7 /100 | #68 | Exceptional 66.2% |
| Sub-Saharan Africans | 99.7 /100 | #69 | Exceptional 66.2% |
| Asians | 99.7 /100 | #70 | Exceptional 66.2% |
| Burmese | 99.7 /100 | #71 | Exceptional 66.2% |
| Taiwanese | 99.7 /100 | #72 | Exceptional 66.2% |
| Immigrants | Vietnam | 99.7 /100 | #73 | Exceptional 66.2% |
| Immigrants | Korea | 99.7 /100 | #74 | Exceptional 66.2% |
| Immigrants | Singapore | 99.7 /100 | #75 | Exceptional 66.2% |
| Immigrants | Malaysia | 99.6 /100 | #76 | Exceptional 66.1% |
| Immigrants | Moldova | 99.6 /100 | #77 | Exceptional 66.1% |
| Immigrants | Asia | 99.6 /100 | #78 | Exceptional 66.1% |
| Turks | 99.6 /100 | #79 | Exceptional 66.1% |
| Malaysians | 99.6 /100 | #80 | Exceptional 66.1% |