Immigrants from Indonesia vs Immigrants from Vietnam In Labor Force | Age > 16
COMPARE
Immigrants from Indonesia
Immigrants from Vietnam
In Labor Force | Age > 16
In Labor Force | Age > 16 Comparison
Immigrants from Indonesia
Immigrants from Vietnam
65.7%
IN LABOR FORCE | AGE > 16
96.8/ 100
METRIC RATING
115th/ 347
METRIC RANK
66.2%
IN LABOR FORCE | AGE > 16
99.7/ 100
METRIC RATING
73rd/ 347
METRIC RANK
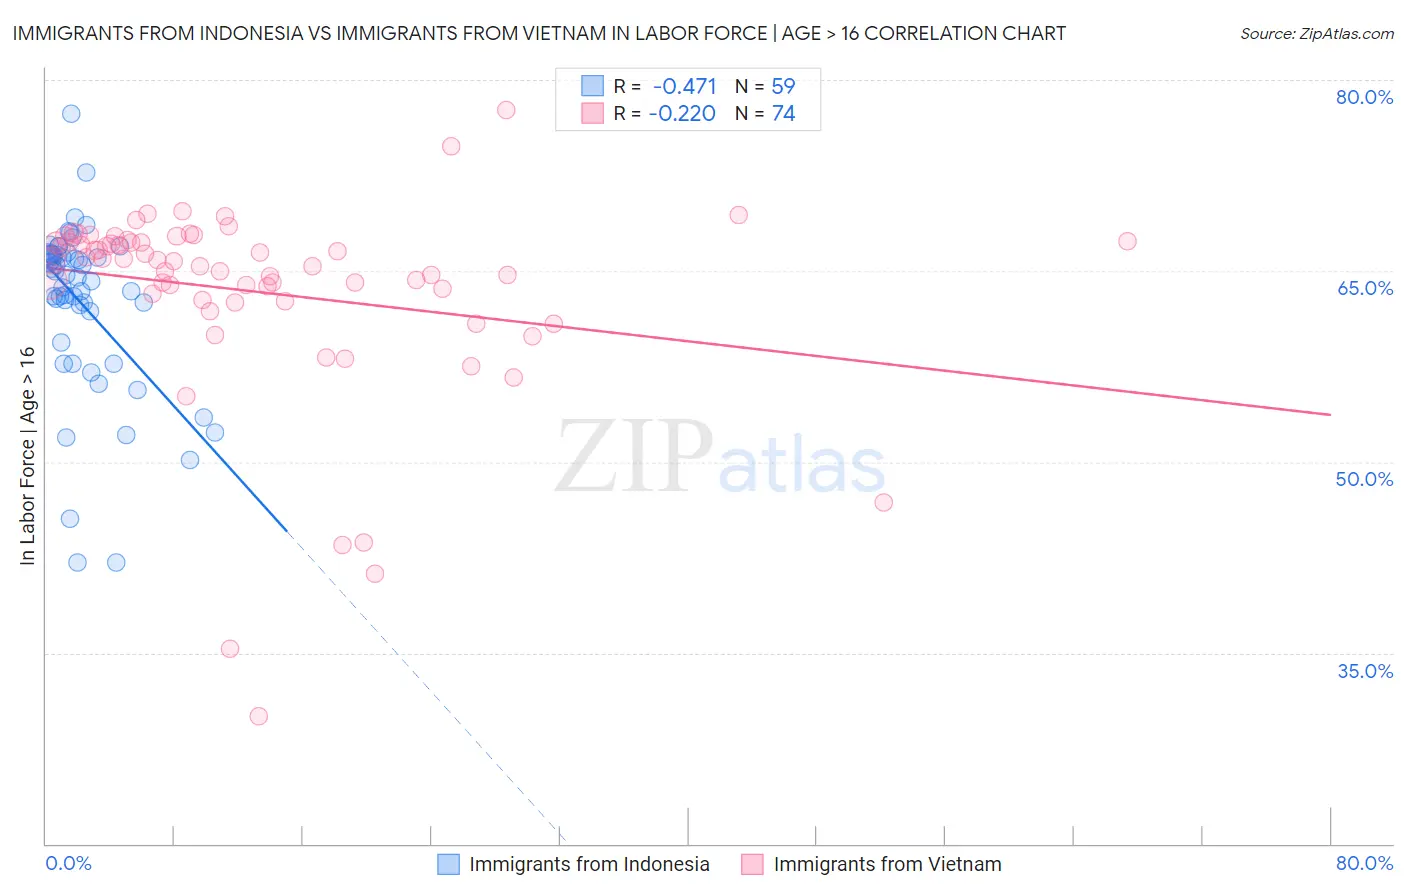
Immigrants from Indonesia vs Immigrants from Vietnam In Labor Force | Age > 16 Correlation Chart
The statistical analysis conducted on geographies consisting of 215,789,599 people shows a moderate negative correlation between the proportion of Immigrants from Indonesia and labor force participation rate among population ages 16 and over in the United States with a correlation coefficient (R) of -0.471 and weighted average of 65.7%. Similarly, the statistical analysis conducted on geographies consisting of 404,839,190 people shows a weak negative correlation between the proportion of Immigrants from Vietnam and labor force participation rate among population ages 16 and over in the United States with a correlation coefficient (R) of -0.220 and weighted average of 66.2%, a difference of 0.67%.
In Labor Force | Age > 16 Correlation Summary
| Measurement | Immigrants from Indonesia | Immigrants from Vietnam |
| Minimum | 42.1% | 30.0% |
| Maximum | 77.3% | 77.6% |
| Range | 35.2% | 47.6% |
| Mean | 62.4% | 63.4% |
| Median | 64.5% | 65.8% |
| Interquartile 25% (IQ1) | 59.4% | 62.7% |
| Interquartile 75% (IQ3) | 66.2% | 67.3% |
| Interquartile Range (IQR) | 6.8% | 4.6% |
| Standard Deviation (Sample) | 6.8% | 8.0% |
| Standard Deviation (Population) | 6.7% | 7.9% |
Similar Demographics by In Labor Force | Age > 16
Demographics Similar to Immigrants from Indonesia by In Labor Force | Age > 16
In terms of in labor force | age > 16, the demographic groups most similar to Immigrants from Indonesia are Argentinean (65.7%, a difference of 0.010%), Immigrants from Iran (65.7%, a difference of 0.010%), Immigrants from Thailand (65.7%, a difference of 0.020%), Pakistani (65.8%, a difference of 0.030%), and Honduran (65.8%, a difference of 0.030%).
| Demographics | Rating | Rank | In Labor Force | Age > 16 |
| Immigrants | Spain | 98.0 /100 | #108 | Exceptional 65.8% |
| Immigrants | Japan | 98.0 /100 | #109 | Exceptional 65.8% |
| Japanese | 97.7 /100 | #110 | Exceptional 65.8% |
| Immigrants | Honduras | 97.5 /100 | #111 | Exceptional 65.8% |
| Laotians | 97.4 /100 | #112 | Exceptional 65.8% |
| Pakistanis | 97.1 /100 | #113 | Exceptional 65.8% |
| Hondurans | 97.1 /100 | #114 | Exceptional 65.8% |
| Immigrants | Indonesia | 96.8 /100 | #115 | Exceptional 65.7% |
| Argentineans | 96.7 /100 | #116 | Exceptional 65.7% |
| Immigrants | Iran | 96.6 /100 | #117 | Exceptional 65.7% |
| Immigrants | Thailand | 96.6 /100 | #118 | Exceptional 65.7% |
| Immigrants | France | 96.4 /100 | #119 | Exceptional 65.7% |
| Immigrants | Hong Kong | 96.2 /100 | #120 | Exceptional 65.7% |
| New Zealanders | 96.0 /100 | #121 | Exceptional 65.7% |
| Immigrants | Ecuador | 95.9 /100 | #122 | Exceptional 65.7% |
Demographics Similar to Immigrants from Vietnam by In Labor Force | Age > 16
In terms of in labor force | age > 16, the demographic groups most similar to Immigrants from Vietnam are Immigrants from Korea (66.2%, a difference of 0.0%), Burmese (66.2%, a difference of 0.010%), Taiwanese (66.2%, a difference of 0.010%), Immigrants from Singapore (66.2%, a difference of 0.010%), and Asian (66.2%, a difference of 0.030%).
| Demographics | Rating | Rank | In Labor Force | Age > 16 |
| Jordanians | 99.8 /100 | #66 | Exceptional 66.3% |
| Egyptians | 99.8 /100 | #67 | Exceptional 66.2% |
| Immigrants | Egypt | 99.7 /100 | #68 | Exceptional 66.2% |
| Sub-Saharan Africans | 99.7 /100 | #69 | Exceptional 66.2% |
| Asians | 99.7 /100 | #70 | Exceptional 66.2% |
| Burmese | 99.7 /100 | #71 | Exceptional 66.2% |
| Taiwanese | 99.7 /100 | #72 | Exceptional 66.2% |
| Immigrants | Vietnam | 99.7 /100 | #73 | Exceptional 66.2% |
| Immigrants | Korea | 99.7 /100 | #74 | Exceptional 66.2% |
| Immigrants | Singapore | 99.7 /100 | #75 | Exceptional 66.2% |
| Immigrants | Malaysia | 99.6 /100 | #76 | Exceptional 66.1% |
| Immigrants | Moldova | 99.6 /100 | #77 | Exceptional 66.1% |
| Immigrants | Asia | 99.6 /100 | #78 | Exceptional 66.1% |
| Turks | 99.6 /100 | #79 | Exceptional 66.1% |
| Malaysians | 99.6 /100 | #80 | Exceptional 66.1% |