Greek vs Immigrants from Vietnam In Labor Force | Age > 16
COMPARE
Greek
Immigrants from Vietnam
In Labor Force | Age > 16
In Labor Force | Age > 16 Comparison
Greeks
Immigrants from Vietnam
64.9%
IN LABOR FORCE | AGE > 16
26.1/ 100
METRIC RATING
198th/ 347
METRIC RANK
66.2%
IN LABOR FORCE | AGE > 16
99.7/ 100
METRIC RATING
73rd/ 347
METRIC RANK
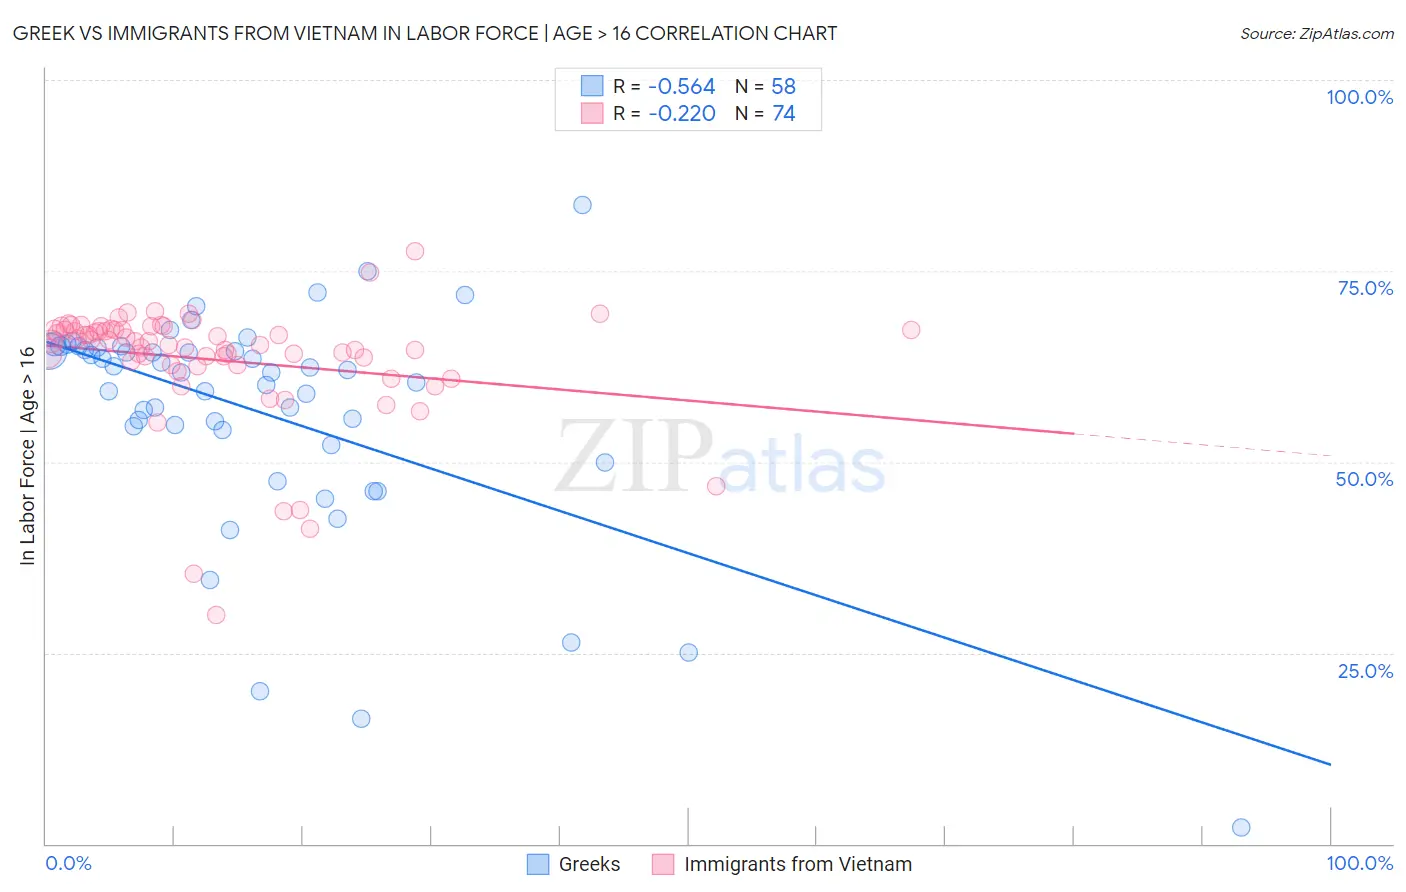
Greek vs Immigrants from Vietnam In Labor Force | Age > 16 Correlation Chart
The statistical analysis conducted on geographies consisting of 482,783,671 people shows a substantial negative correlation between the proportion of Greeks and labor force participation rate among population ages 16 and over in the United States with a correlation coefficient (R) of -0.564 and weighted average of 64.9%. Similarly, the statistical analysis conducted on geographies consisting of 404,839,190 people shows a weak negative correlation between the proportion of Immigrants from Vietnam and labor force participation rate among population ages 16 and over in the United States with a correlation coefficient (R) of -0.220 and weighted average of 66.2%, a difference of 1.9%.
In Labor Force | Age > 16 Correlation Summary
| Measurement | Greek | Immigrants from Vietnam |
| Minimum | 2.1% | 30.0% |
| Maximum | 83.6% | 77.6% |
| Range | 81.5% | 47.6% |
| Mean | 56.5% | 63.4% |
| Median | 61.7% | 65.8% |
| Interquartile 25% (IQ1) | 54.1% | 62.7% |
| Interquartile 75% (IQ3) | 65.0% | 67.3% |
| Interquartile Range (IQR) | 10.9% | 4.6% |
| Standard Deviation (Sample) | 14.9% | 8.0% |
| Standard Deviation (Population) | 14.8% | 7.9% |
Similar Demographics by In Labor Force | Age > 16
Demographics Similar to Greeks by In Labor Force | Age > 16
In terms of in labor force | age > 16, the demographic groups most similar to Greeks are Immigrants from Italy (65.0%, a difference of 0.040%), Mexican American Indian (64.9%, a difference of 0.050%), Haitian (65.0%, a difference of 0.060%), Immigrants from Southern Europe (65.0%, a difference of 0.070%), and Romanian (65.0%, a difference of 0.070%).
| Demographics | Rating | Rank | In Labor Force | Age > 16 |
| Scandinavians | 33.7 /100 | #191 | Fair 65.0% |
| Immigrants | Fiji | 33.7 /100 | #192 | Fair 65.0% |
| Immigrants | Europe | 33.6 /100 | #193 | Fair 65.0% |
| Immigrants | Southern Europe | 31.3 /100 | #194 | Fair 65.0% |
| Romanians | 31.1 /100 | #195 | Fair 65.0% |
| Haitians | 30.6 /100 | #196 | Fair 65.0% |
| Immigrants | Italy | 28.7 /100 | #197 | Fair 65.0% |
| Greeks | 26.1 /100 | #198 | Fair 64.9% |
| Mexican American Indians | 23.1 /100 | #199 | Fair 64.9% |
| Armenians | 20.2 /100 | #200 | Fair 64.9% |
| Ukrainians | 19.6 /100 | #201 | Poor 64.9% |
| Immigrants | Belgium | 19.4 /100 | #202 | Poor 64.9% |
| Russians | 18.8 /100 | #203 | Poor 64.9% |
| Slovenes | 18.7 /100 | #204 | Poor 64.9% |
| Jamaicans | 18.7 /100 | #205 | Poor 64.9% |
Demographics Similar to Immigrants from Vietnam by In Labor Force | Age > 16
In terms of in labor force | age > 16, the demographic groups most similar to Immigrants from Vietnam are Immigrants from Korea (66.2%, a difference of 0.0%), Burmese (66.2%, a difference of 0.010%), Taiwanese (66.2%, a difference of 0.010%), Immigrants from Singapore (66.2%, a difference of 0.010%), and Asian (66.2%, a difference of 0.030%).
| Demographics | Rating | Rank | In Labor Force | Age > 16 |
| Jordanians | 99.8 /100 | #66 | Exceptional 66.3% |
| Egyptians | 99.8 /100 | #67 | Exceptional 66.2% |
| Immigrants | Egypt | 99.7 /100 | #68 | Exceptional 66.2% |
| Sub-Saharan Africans | 99.7 /100 | #69 | Exceptional 66.2% |
| Asians | 99.7 /100 | #70 | Exceptional 66.2% |
| Burmese | 99.7 /100 | #71 | Exceptional 66.2% |
| Taiwanese | 99.7 /100 | #72 | Exceptional 66.2% |
| Immigrants | Vietnam | 99.7 /100 | #73 | Exceptional 66.2% |
| Immigrants | Korea | 99.7 /100 | #74 | Exceptional 66.2% |
| Immigrants | Singapore | 99.7 /100 | #75 | Exceptional 66.2% |
| Immigrants | Malaysia | 99.6 /100 | #76 | Exceptional 66.1% |
| Immigrants | Moldova | 99.6 /100 | #77 | Exceptional 66.1% |
| Immigrants | Asia | 99.6 /100 | #78 | Exceptional 66.1% |
| Turks | 99.6 /100 | #79 | Exceptional 66.1% |
| Malaysians | 99.6 /100 | #80 | Exceptional 66.1% |