Immigrants from Germany vs Chickasaw In Labor Force | Age 16-19
COMPARE
Immigrants from Germany
Chickasaw
In Labor Force | Age 16-19
In Labor Force | Age 16-19 Comparison
Immigrants from Germany
Chickasaw
39.1%
IN LABOR FORCE | AGE 16-19
99.6/ 100
METRIC RATING
87th/ 347
METRIC RANK
38.3%
IN LABOR FORCE | AGE 16-19
97.8/ 100
METRIC RATING
117th/ 347
METRIC RANK
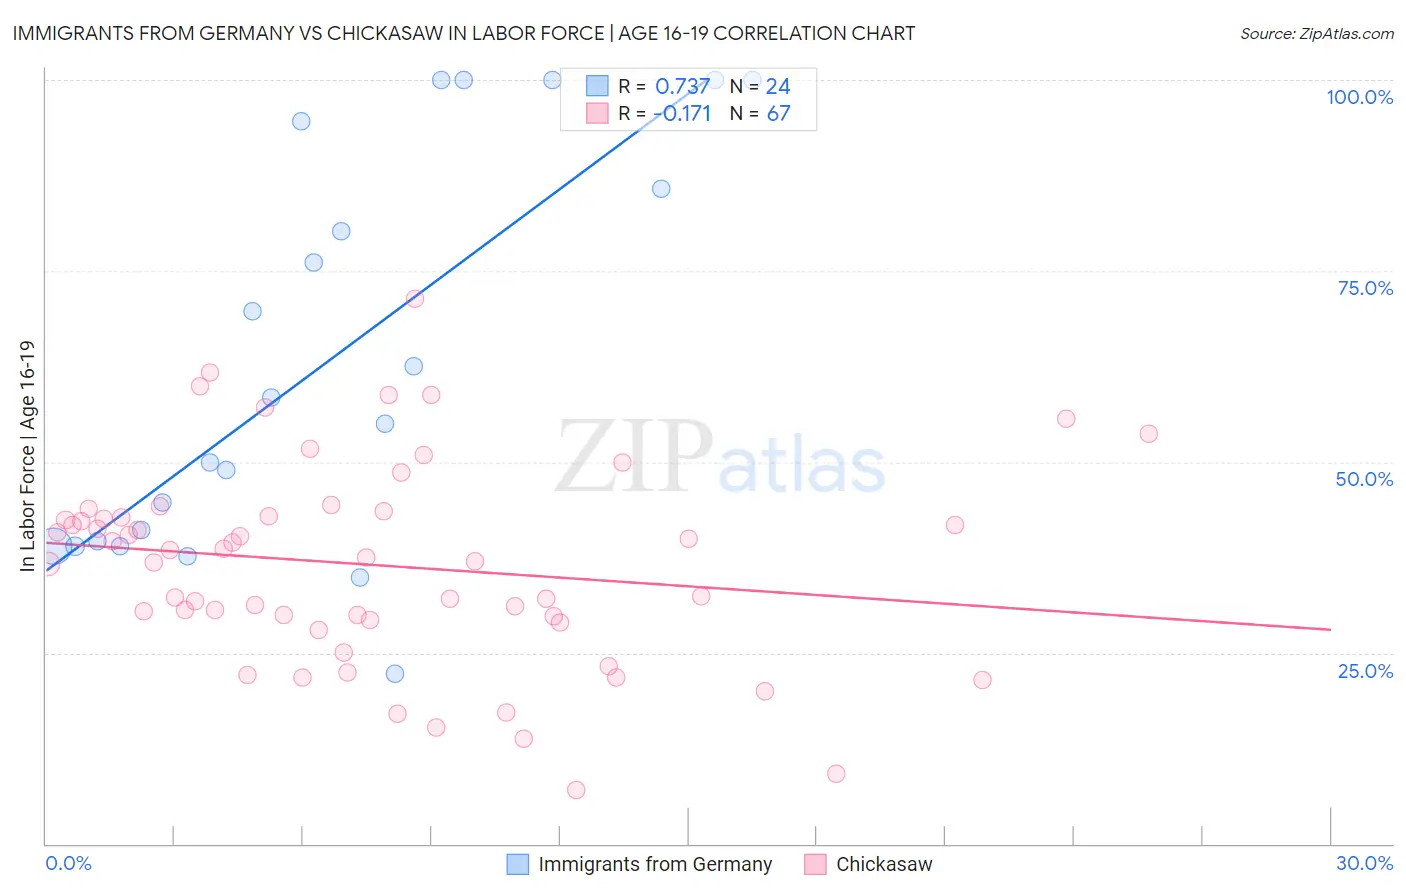
Immigrants from Germany vs Chickasaw In Labor Force | Age 16-19 Correlation Chart
The statistical analysis conducted on geographies consisting of 462,642,195 people shows a strong positive correlation between the proportion of Immigrants from Germany and labor force participation rate among population between the ages 16 and 19 in the United States with a correlation coefficient (R) of 0.737 and weighted average of 39.1%. Similarly, the statistical analysis conducted on geographies consisting of 147,579,210 people shows a poor negative correlation between the proportion of Chickasaw and labor force participation rate among population between the ages 16 and 19 in the United States with a correlation coefficient (R) of -0.171 and weighted average of 38.3%, a difference of 2.0%.
In Labor Force | Age 16-19 Correlation Summary
| Measurement | Immigrants from Germany | Chickasaw |
| Minimum | 22.2% | 7.1% |
| Maximum | 100.0% | 71.4% |
| Range | 77.8% | 64.3% |
| Mean | 63.2% | 36.5% |
| Median | 56.7% | 37.5% |
| Interquartile 25% (IQ1) | 39.3% | 29.4% |
| Interquartile 75% (IQ3) | 90.1% | 42.8% |
| Interquartile Range (IQR) | 50.8% | 13.5% |
| Standard Deviation (Sample) | 26.0% | 13.1% |
| Standard Deviation (Population) | 25.4% | 13.0% |
Similar Demographics by In Labor Force | Age 16-19
Demographics Similar to Immigrants from Germany by In Labor Force | Age 16-19
In terms of in labor force | age 16-19, the demographic groups most similar to Immigrants from Germany are Puget Sound Salish (39.1%, a difference of 0.070%), Samoan (39.1%, a difference of 0.080%), Alaska Native (39.1%, a difference of 0.080%), Creek (39.1%, a difference of 0.10%), and Immigrants from Burma/Myanmar (39.0%, a difference of 0.16%).
| Demographics | Rating | Rank | In Labor Force | Age 16-19 |
| Immigrants | Iraq | 99.8 /100 | #80 | Exceptional 39.4% |
| Shoshone | 99.7 /100 | #81 | Exceptional 39.3% |
| Basques | 99.7 /100 | #82 | Exceptional 39.3% |
| Spanish | 99.7 /100 | #83 | Exceptional 39.3% |
| Immigrants | Uganda | 99.7 /100 | #84 | Exceptional 39.2% |
| Creek | 99.6 /100 | #85 | Exceptional 39.1% |
| Samoans | 99.6 /100 | #86 | Exceptional 39.1% |
| Immigrants | Germany | 99.6 /100 | #87 | Exceptional 39.1% |
| Puget Sound Salish | 99.6 /100 | #88 | Exceptional 39.1% |
| Alaska Natives | 99.6 /100 | #89 | Exceptional 39.1% |
| Immigrants | Burma/Myanmar | 99.5 /100 | #90 | Exceptional 39.0% |
| Spanish Americans | 99.5 /100 | #91 | Exceptional 39.0% |
| Osage | 99.4 /100 | #92 | Exceptional 39.0% |
| Blackfeet | 99.4 /100 | #93 | Exceptional 38.9% |
| Immigrants | Canada | 99.4 /100 | #94 | Exceptional 38.9% |
Demographics Similar to Chickasaw by In Labor Force | Age 16-19
In terms of in labor force | age 16-19, the demographic groups most similar to Chickasaw are Immigrants from Nepal (38.3%, a difference of 0.010%), Assyrian/Chaldean/Syriac (38.3%, a difference of 0.030%), Colville (38.3%, a difference of 0.050%), Bulgarian (38.3%, a difference of 0.060%), and Ukrainian (38.3%, a difference of 0.11%).
| Demographics | Rating | Rank | In Labor Force | Age 16-19 |
| Maltese | 98.6 /100 | #110 | Exceptional 38.5% |
| Crow | 98.5 /100 | #111 | Exceptional 38.5% |
| Immigrants | Scotland | 98.5 /100 | #112 | Exceptional 38.5% |
| Sub-Saharan Africans | 98.3 /100 | #113 | Exceptional 38.4% |
| Hawaiians | 98.2 /100 | #114 | Exceptional 38.4% |
| Bulgarians | 97.9 /100 | #115 | Exceptional 38.3% |
| Colville | 97.9 /100 | #116 | Exceptional 38.3% |
| Chickasaw | 97.8 /100 | #117 | Exceptional 38.3% |
| Immigrants | Nepal | 97.8 /100 | #118 | Exceptional 38.3% |
| Assyrians/Chaldeans/Syriacs | 97.8 /100 | #119 | Exceptional 38.3% |
| Ukrainians | 97.6 /100 | #120 | Exceptional 38.3% |
| Ethiopians | 97.4 /100 | #121 | Exceptional 38.2% |
| Guamanians/Chamorros | 97.4 /100 | #122 | Exceptional 38.2% |
| Seminole | 96.7 /100 | #123 | Exceptional 38.1% |
| Immigrants | England | 96.4 /100 | #124 | Exceptional 38.1% |