Immigrants from Germany vs Immigrants from Korea In Labor Force | Age 16-19
COMPARE
Immigrants from Germany
Immigrants from Korea
In Labor Force | Age 16-19
In Labor Force | Age 16-19 Comparison
Immigrants from Germany
Immigrants from Korea
39.1%
IN LABOR FORCE | AGE 16-19
99.6/ 100
METRIC RATING
87th/ 347
METRIC RANK
33.8%
IN LABOR FORCE | AGE 16-19
0.3/ 100
METRIC RATING
282nd/ 347
METRIC RANK
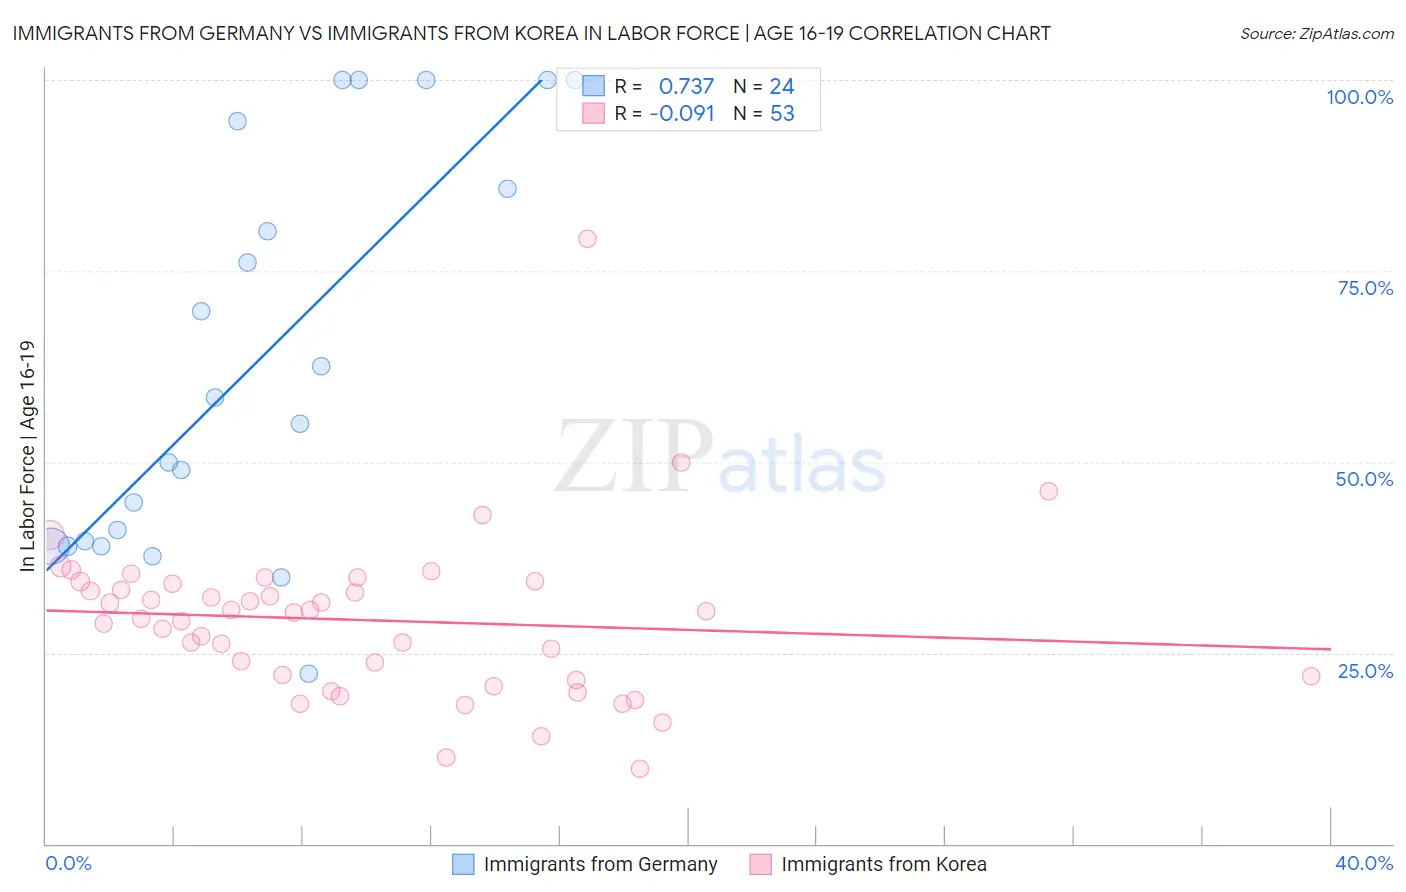
Immigrants from Germany vs Immigrants from Korea In Labor Force | Age 16-19 Correlation Chart
The statistical analysis conducted on geographies consisting of 462,642,195 people shows a strong positive correlation between the proportion of Immigrants from Germany and labor force participation rate among population between the ages 16 and 19 in the United States with a correlation coefficient (R) of 0.737 and weighted average of 39.1%. Similarly, the statistical analysis conducted on geographies consisting of 415,630,206 people shows a slight negative correlation between the proportion of Immigrants from Korea and labor force participation rate among population between the ages 16 and 19 in the United States with a correlation coefficient (R) of -0.091 and weighted average of 33.8%, a difference of 15.6%.
In Labor Force | Age 16-19 Correlation Summary
| Measurement | Immigrants from Germany | Immigrants from Korea |
| Minimum | 22.2% | 9.8% |
| Maximum | 100.0% | 79.2% |
| Range | 77.8% | 69.4% |
| Mean | 63.2% | 29.3% |
| Median | 56.7% | 30.3% |
| Interquartile 25% (IQ1) | 39.3% | 21.6% |
| Interquartile 75% (IQ3) | 90.1% | 34.2% |
| Interquartile Range (IQR) | 50.8% | 12.6% |
| Standard Deviation (Sample) | 26.0% | 10.9% |
| Standard Deviation (Population) | 25.4% | 10.8% |
Similar Demographics by In Labor Force | Age 16-19
Demographics Similar to Immigrants from Germany by In Labor Force | Age 16-19
In terms of in labor force | age 16-19, the demographic groups most similar to Immigrants from Germany are Puget Sound Salish (39.1%, a difference of 0.070%), Samoan (39.1%, a difference of 0.080%), Alaska Native (39.1%, a difference of 0.080%), Creek (39.1%, a difference of 0.10%), and Immigrants from Burma/Myanmar (39.0%, a difference of 0.16%).
| Demographics | Rating | Rank | In Labor Force | Age 16-19 |
| Immigrants | Iraq | 99.8 /100 | #80 | Exceptional 39.4% |
| Shoshone | 99.7 /100 | #81 | Exceptional 39.3% |
| Basques | 99.7 /100 | #82 | Exceptional 39.3% |
| Spanish | 99.7 /100 | #83 | Exceptional 39.3% |
| Immigrants | Uganda | 99.7 /100 | #84 | Exceptional 39.2% |
| Creek | 99.6 /100 | #85 | Exceptional 39.1% |
| Samoans | 99.6 /100 | #86 | Exceptional 39.1% |
| Immigrants | Germany | 99.6 /100 | #87 | Exceptional 39.1% |
| Puget Sound Salish | 99.6 /100 | #88 | Exceptional 39.1% |
| Alaska Natives | 99.6 /100 | #89 | Exceptional 39.1% |
| Immigrants | Burma/Myanmar | 99.5 /100 | #90 | Exceptional 39.0% |
| Spanish Americans | 99.5 /100 | #91 | Exceptional 39.0% |
| Osage | 99.4 /100 | #92 | Exceptional 39.0% |
| Blackfeet | 99.4 /100 | #93 | Exceptional 38.9% |
| Immigrants | Canada | 99.4 /100 | #94 | Exceptional 38.9% |
Demographics Similar to Immigrants from Korea by In Labor Force | Age 16-19
In terms of in labor force | age 16-19, the demographic groups most similar to Immigrants from Korea are Cypriot (33.8%, a difference of 0.010%), Paraguayan (33.8%, a difference of 0.020%), Taiwanese (33.8%, a difference of 0.020%), Colombian (33.8%, a difference of 0.030%), and Menominee (33.9%, a difference of 0.11%).
| Demographics | Rating | Rank | In Labor Force | Age 16-19 |
| Immigrants | Fiji | 0.3 /100 | #275 | Tragic 33.9% |
| Immigrants | Latin America | 0.3 /100 | #276 | Tragic 33.9% |
| Menominee | 0.3 /100 | #277 | Tragic 33.9% |
| Colombians | 0.3 /100 | #278 | Tragic 33.8% |
| Paraguayans | 0.3 /100 | #279 | Tragic 33.8% |
| Taiwanese | 0.3 /100 | #280 | Tragic 33.8% |
| Cypriots | 0.3 /100 | #281 | Tragic 33.8% |
| Immigrants | Korea | 0.3 /100 | #282 | Tragic 33.8% |
| Immigrants | Venezuela | 0.2 /100 | #283 | Tragic 33.7% |
| Immigrants | Spain | 0.2 /100 | #284 | Tragic 33.7% |
| U.S. Virgin Islanders | 0.2 /100 | #285 | Tragic 33.6% |
| South Americans | 0.2 /100 | #286 | Tragic 33.6% |
| Nepalese | 0.1 /100 | #287 | Tragic 33.5% |
| Immigrants | Indonesia | 0.1 /100 | #288 | Tragic 33.5% |
| Immigrants | Singapore | 0.1 /100 | #289 | Tragic 33.5% |