Immigrants from Europe vs Immigrants from Eritrea In Labor Force | Age 16-19
COMPARE
Immigrants from Europe
Immigrants from Eritrea
In Labor Force | Age 16-19
In Labor Force | Age 16-19 Comparison
Immigrants from Europe
Immigrants from Eritrea
36.2%
IN LABOR FORCE | AGE 16-19
31.8/ 100
METRIC RATING
188th/ 347
METRIC RANK
38.7%
IN LABOR FORCE | AGE 16-19
99.0/ 100
METRIC RATING
104th/ 347
METRIC RANK
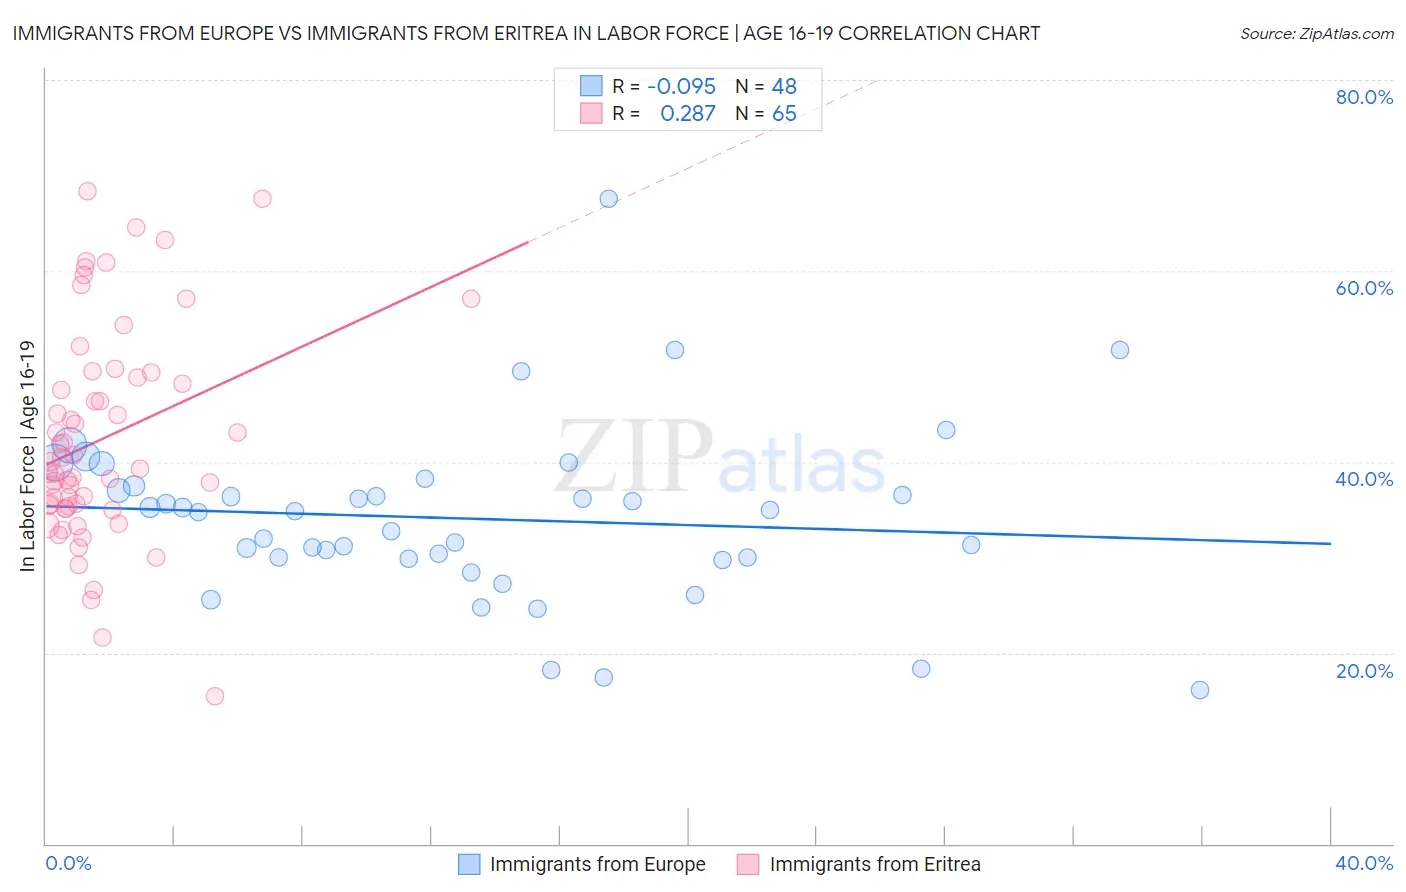
Immigrants from Europe vs Immigrants from Eritrea In Labor Force | Age 16-19 Correlation Chart
The statistical analysis conducted on geographies consisting of 544,647,771 people shows a slight negative correlation between the proportion of Immigrants from Europe and labor force participation rate among population between the ages 16 and 19 in the United States with a correlation coefficient (R) of -0.095 and weighted average of 36.2%. Similarly, the statistical analysis conducted on geographies consisting of 104,843,634 people shows a weak positive correlation between the proportion of Immigrants from Eritrea and labor force participation rate among population between the ages 16 and 19 in the United States with a correlation coefficient (R) of 0.287 and weighted average of 38.7%, a difference of 6.8%.
In Labor Force | Age 16-19 Correlation Summary
| Measurement | Immigrants from Europe | Immigrants from Eritrea |
| Minimum | 16.1% | 15.4% |
| Maximum | 67.6% | 68.4% |
| Range | 51.5% | 53.0% |
| Mean | 34.1% | 42.4% |
| Median | 34.8% | 39.2% |
| Interquartile 25% (IQ1) | 29.9% | 35.3% |
| Interquartile 75% (IQ3) | 37.2% | 49.1% |
| Interquartile Range (IQR) | 7.3% | 13.9% |
| Standard Deviation (Sample) | 9.2% | 11.3% |
| Standard Deviation (Population) | 9.1% | 11.2% |
Similar Demographics by In Labor Force | Age 16-19
Demographics Similar to Immigrants from Europe by In Labor Force | Age 16-19
In terms of in labor force | age 16-19, the demographic groups most similar to Immigrants from Europe are Immigrants from Romania (36.3%, a difference of 0.13%), Immigrants from Afghanistan (36.3%, a difference of 0.13%), Immigrants from Hungary (36.2%, a difference of 0.18%), Panamanian (36.1%, a difference of 0.19%), and Bhutanese (36.3%, a difference of 0.20%).
| Demographics | Rating | Rank | In Labor Force | Age 16-19 |
| Jordanians | 39.6 /100 | #181 | Fair 36.4% |
| Immigrants | Italy | 39.1 /100 | #182 | Fair 36.4% |
| Eastern Europeans | 38.8 /100 | #183 | Fair 36.4% |
| Costa Ricans | 36.1 /100 | #184 | Fair 36.3% |
| Bhutanese | 35.3 /100 | #185 | Fair 36.3% |
| Immigrants | Romania | 34.0 /100 | #186 | Fair 36.3% |
| Immigrants | Afghanistan | 34.0 /100 | #187 | Fair 36.3% |
| Immigrants | Europe | 31.8 /100 | #188 | Fair 36.2% |
| Immigrants | Hungary | 28.8 /100 | #189 | Fair 36.2% |
| Panamanians | 28.6 /100 | #190 | Fair 36.1% |
| Immigrants | Croatia | 27.5 /100 | #191 | Fair 36.1% |
| Afghans | 25.7 /100 | #192 | Fair 36.1% |
| Immigrants | Denmark | 25.0 /100 | #193 | Fair 36.1% |
| Nigerians | 24.6 /100 | #194 | Fair 36.1% |
| Bolivians | 23.3 /100 | #195 | Fair 36.0% |
Demographics Similar to Immigrants from Eritrea by In Labor Force | Age 16-19
In terms of in labor force | age 16-19, the demographic groups most similar to Immigrants from Eritrea are Immigrants from Cameroon (38.7%, a difference of 0.050%), Hmong (38.7%, a difference of 0.090%), Zimbabwean (38.7%, a difference of 0.090%), Immigrants from Thailand (38.7%, a difference of 0.16%), and Iraqi (38.6%, a difference of 0.16%).
| Demographics | Rating | Rank | In Labor Force | Age 16-19 |
| Greeks | 99.3 /100 | #97 | Exceptional 38.9% |
| Ugandans | 99.3 /100 | #98 | Exceptional 38.9% |
| Immigrants | North Macedonia | 99.3 /100 | #99 | Exceptional 38.9% |
| Immigrants | Thailand | 99.1 /100 | #100 | Exceptional 38.7% |
| Hmong | 99.1 /100 | #101 | Exceptional 38.7% |
| Zimbabweans | 99.1 /100 | #102 | Exceptional 38.7% |
| Immigrants | Cameroon | 99.0 /100 | #103 | Exceptional 38.7% |
| Immigrants | Eritrea | 99.0 /100 | #104 | Exceptional 38.7% |
| Iraqis | 98.9 /100 | #105 | Exceptional 38.6% |
| Delaware | 98.8 /100 | #106 | Exceptional 38.6% |
| Chinese | 98.8 /100 | #107 | Exceptional 38.6% |
| Immigrants | Ethiopia | 98.7 /100 | #108 | Exceptional 38.6% |
| Lebanese | 98.7 /100 | #109 | Exceptional 38.6% |
| Maltese | 98.6 /100 | #110 | Exceptional 38.5% |
| Crow | 98.5 /100 | #111 | Exceptional 38.5% |