Immigrants from Europe vs Ecuadorian In Labor Force | Age 16-19
COMPARE
Immigrants from Europe
Ecuadorian
In Labor Force | Age 16-19
In Labor Force | Age 16-19 Comparison
Immigrants from Europe
Ecuadorians
36.2%
IN LABOR FORCE | AGE 16-19
31.8/ 100
METRIC RATING
188th/ 347
METRIC RANK
31.4%
IN LABOR FORCE | AGE 16-19
0.0/ 100
METRIC RATING
320th/ 347
METRIC RANK
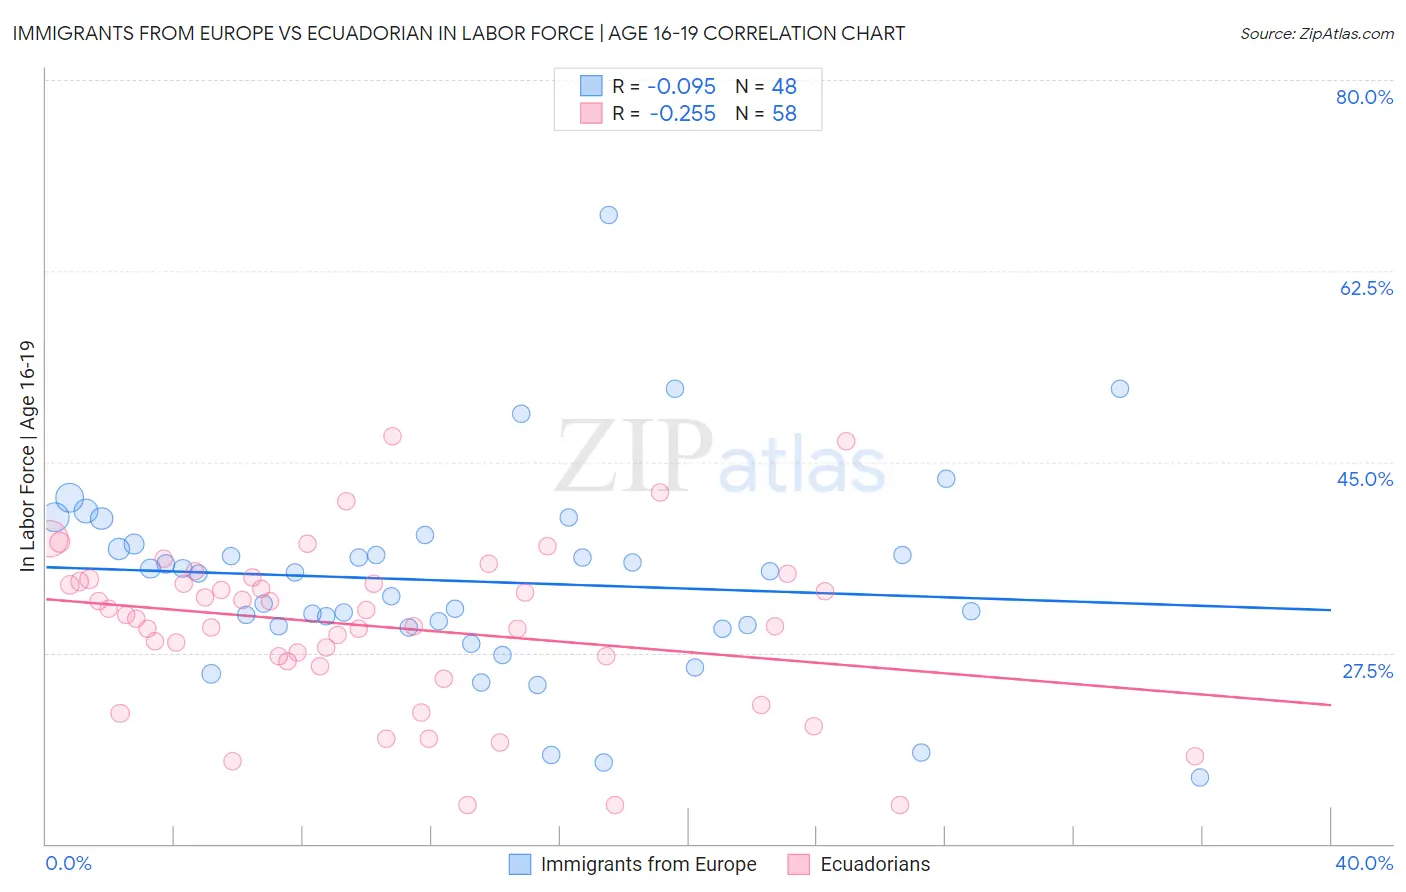
Immigrants from Europe vs Ecuadorian In Labor Force | Age 16-19 Correlation Chart
The statistical analysis conducted on geographies consisting of 544,647,771 people shows a slight negative correlation between the proportion of Immigrants from Europe and labor force participation rate among population between the ages 16 and 19 in the United States with a correlation coefficient (R) of -0.095 and weighted average of 36.2%. Similarly, the statistical analysis conducted on geographies consisting of 317,507,621 people shows a weak negative correlation between the proportion of Ecuadorians and labor force participation rate among population between the ages 16 and 19 in the United States with a correlation coefficient (R) of -0.255 and weighted average of 31.4%, a difference of 15.4%.
In Labor Force | Age 16-19 Correlation Summary
| Measurement | Immigrants from Europe | Ecuadorian |
| Minimum | 16.1% | 13.6% |
| Maximum | 67.6% | 47.4% |
| Range | 51.5% | 33.8% |
| Mean | 34.1% | 29.9% |
| Median | 34.8% | 30.8% |
| Interquartile 25% (IQ1) | 29.9% | 26.7% |
| Interquartile 75% (IQ3) | 37.2% | 34.0% |
| Interquartile Range (IQR) | 7.3% | 7.3% |
| Standard Deviation (Sample) | 9.2% | 7.4% |
| Standard Deviation (Population) | 9.1% | 7.4% |
Similar Demographics by In Labor Force | Age 16-19
Demographics Similar to Immigrants from Europe by In Labor Force | Age 16-19
In terms of in labor force | age 16-19, the demographic groups most similar to Immigrants from Europe are Immigrants from Romania (36.3%, a difference of 0.13%), Immigrants from Afghanistan (36.3%, a difference of 0.13%), Immigrants from Hungary (36.2%, a difference of 0.18%), Panamanian (36.1%, a difference of 0.19%), and Bhutanese (36.3%, a difference of 0.20%).
| Demographics | Rating | Rank | In Labor Force | Age 16-19 |
| Jordanians | 39.6 /100 | #181 | Fair 36.4% |
| Immigrants | Italy | 39.1 /100 | #182 | Fair 36.4% |
| Eastern Europeans | 38.8 /100 | #183 | Fair 36.4% |
| Costa Ricans | 36.1 /100 | #184 | Fair 36.3% |
| Bhutanese | 35.3 /100 | #185 | Fair 36.3% |
| Immigrants | Romania | 34.0 /100 | #186 | Fair 36.3% |
| Immigrants | Afghanistan | 34.0 /100 | #187 | Fair 36.3% |
| Immigrants | Europe | 31.8 /100 | #188 | Fair 36.2% |
| Immigrants | Hungary | 28.8 /100 | #189 | Fair 36.2% |
| Panamanians | 28.6 /100 | #190 | Fair 36.1% |
| Immigrants | Croatia | 27.5 /100 | #191 | Fair 36.1% |
| Afghans | 25.7 /100 | #192 | Fair 36.1% |
| Immigrants | Denmark | 25.0 /100 | #193 | Fair 36.1% |
| Nigerians | 24.6 /100 | #194 | Fair 36.1% |
| Bolivians | 23.3 /100 | #195 | Fair 36.0% |
Demographics Similar to Ecuadorians by In Labor Force | Age 16-19
In terms of in labor force | age 16-19, the demographic groups most similar to Ecuadorians are Soviet Union (31.4%, a difference of 0.060%), West Indian (31.3%, a difference of 0.23%), Tohono O'odham (31.3%, a difference of 0.35%), Immigrants from Yemen (31.5%, a difference of 0.38%), and Immigrants from Caribbean (31.2%, a difference of 0.48%).
| Demographics | Rating | Rank | In Labor Force | Age 16-19 |
| Hopi | 0.0 /100 | #313 | Tragic 31.8% |
| Cubans | 0.0 /100 | #314 | Tragic 31.8% |
| Immigrants | West Indies | 0.0 /100 | #315 | Tragic 31.7% |
| Filipinos | 0.0 /100 | #316 | Tragic 31.7% |
| Immigrants | Nicaragua | 0.0 /100 | #317 | Tragic 31.6% |
| Immigrants | Yemen | 0.0 /100 | #318 | Tragic 31.5% |
| Soviet Union | 0.0 /100 | #319 | Tragic 31.4% |
| Ecuadorians | 0.0 /100 | #320 | Tragic 31.4% |
| West Indians | 0.0 /100 | #321 | Tragic 31.3% |
| Tohono O'odham | 0.0 /100 | #322 | Tragic 31.3% |
| Immigrants | Caribbean | 0.0 /100 | #323 | Tragic 31.2% |
| Dominicans | 0.0 /100 | #324 | Tragic 31.2% |
| Immigrants | China | 0.0 /100 | #325 | Tragic 31.1% |
| Immigrants | Dominican Republic | 0.0 /100 | #326 | Tragic 31.1% |
| Immigrants | Taiwan | 0.0 /100 | #327 | Tragic 31.0% |