Immigrants from Ethiopia vs Immigrants from Bulgaria In Labor Force | Age 20-24
COMPARE
Immigrants from Ethiopia
Immigrants from Bulgaria
In Labor Force | Age 20-24
In Labor Force | Age 20-24 Comparison
Immigrants from Ethiopia
Immigrants from Bulgaria
77.5%
IN LABOR FORCE | AGE 20-24
100.0/ 100
METRIC RATING
33rd/ 347
METRIC RANK
75.8%
IN LABOR FORCE | AGE 20-24
94.1/ 100
METRIC RATING
123rd/ 347
METRIC RANK
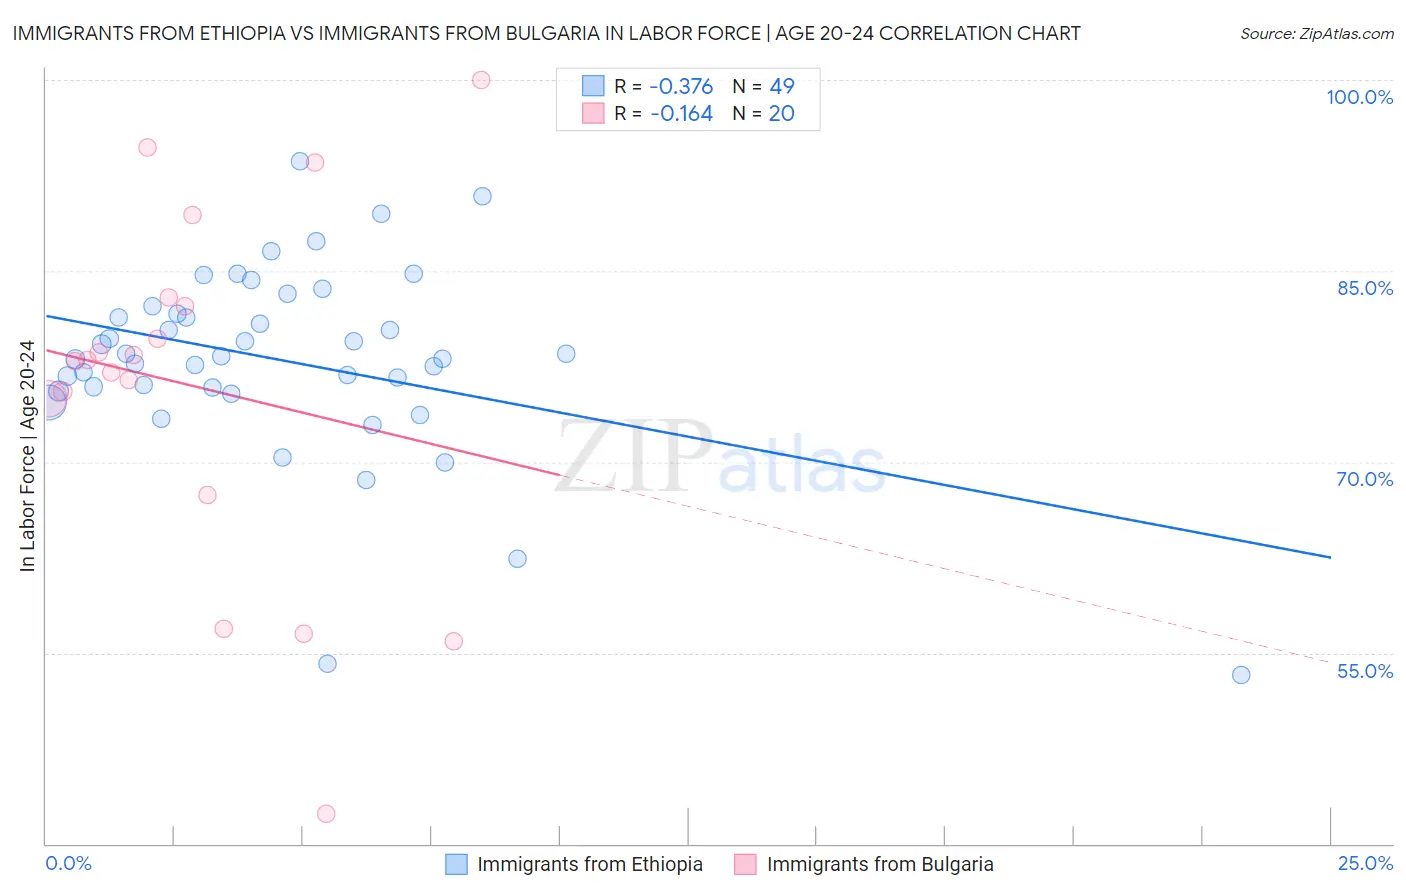
Immigrants from Ethiopia vs Immigrants from Bulgaria In Labor Force | Age 20-24 Correlation Chart
The statistical analysis conducted on geographies consisting of 211,552,880 people shows a mild negative correlation between the proportion of Immigrants from Ethiopia and labor force participation rate among population between the ages 20 and 24 in the United States with a correlation coefficient (R) of -0.376 and weighted average of 77.5%. Similarly, the statistical analysis conducted on geographies consisting of 172,510,065 people shows a poor negative correlation between the proportion of Immigrants from Bulgaria and labor force participation rate among population between the ages 20 and 24 in the United States with a correlation coefficient (R) of -0.164 and weighted average of 75.8%, a difference of 2.3%.
In Labor Force | Age 20-24 Correlation Summary
| Measurement | Immigrants from Ethiopia | Immigrants from Bulgaria |
| Minimum | 53.3% | 42.4% |
| Maximum | 93.6% | 100.0% |
| Range | 40.3% | 57.6% |
| Mean | 78.0% | 75.9% |
| Median | 78.3% | 77.9% |
| Interquartile 25% (IQ1) | 75.7% | 71.2% |
| Interquartile 75% (IQ3) | 81.9% | 82.6% |
| Interquartile Range (IQR) | 6.2% | 11.4% |
| Standard Deviation (Sample) | 7.6% | 14.3% |
| Standard Deviation (Population) | 7.5% | 13.9% |
Similar Demographics by In Labor Force | Age 20-24
Demographics Similar to Immigrants from Ethiopia by In Labor Force | Age 20-24
In terms of in labor force | age 20-24, the demographic groups most similar to Immigrants from Ethiopia are German Russian (77.5%, a difference of 0.010%), Immigrants from Eastern Africa (77.5%, a difference of 0.020%), Welsh (77.5%, a difference of 0.040%), English (77.6%, a difference of 0.050%), and Czechoslovakian (77.5%, a difference of 0.050%).
| Demographics | Rating | Rank | In Labor Force | Age 20-24 |
| Tongans | 100.0 /100 | #26 | Exceptional 77.9% |
| Immigrants | Micronesia | 100.0 /100 | #27 | Exceptional 77.8% |
| Belgians | 100.0 /100 | #28 | Exceptional 77.8% |
| Slovaks | 100.0 /100 | #29 | Exceptional 77.7% |
| Swiss | 100.0 /100 | #30 | Exceptional 77.7% |
| Poles | 100.0 /100 | #31 | Exceptional 77.6% |
| English | 100.0 /100 | #32 | Exceptional 77.6% |
| Immigrants | Ethiopia | 100.0 /100 | #33 | Exceptional 77.5% |
| German Russians | 100.0 /100 | #34 | Exceptional 77.5% |
| Immigrants | Eastern Africa | 100.0 /100 | #35 | Exceptional 77.5% |
| Welsh | 100.0 /100 | #36 | Exceptional 77.5% |
| Czechoslovakians | 100.0 /100 | #37 | Exceptional 77.5% |
| Marshallese | 100.0 /100 | #38 | Exceptional 77.4% |
| Irish | 100.0 /100 | #39 | Exceptional 77.4% |
| Scottish | 100.0 /100 | #40 | Exceptional 77.4% |
Demographics Similar to Immigrants from Bulgaria by In Labor Force | Age 20-24
In terms of in labor force | age 20-24, the demographic groups most similar to Immigrants from Bulgaria are Pakistani (75.8%, a difference of 0.0%), Immigrants from Serbia (75.8%, a difference of 0.010%), Immigrants from Sierra Leone (75.8%, a difference of 0.020%), Immigrants from Scotland (75.8%, a difference of 0.030%), and Immigrants from Africa (75.8%, a difference of 0.040%).
| Demographics | Rating | Rank | In Labor Force | Age 20-24 |
| Immigrants | North America | 95.0 /100 | #116 | Exceptional 75.9% |
| Assyrians/Chaldeans/Syriacs | 94.9 /100 | #117 | Exceptional 75.9% |
| Spanish Americans | 94.8 /100 | #118 | Exceptional 75.8% |
| Immigrants | Portugal | 94.8 /100 | #119 | Exceptional 75.8% |
| Immigrants | Africa | 94.6 /100 | #120 | Exceptional 75.8% |
| Immigrants | Serbia | 94.3 /100 | #121 | Exceptional 75.8% |
| Pakistanis | 94.1 /100 | #122 | Exceptional 75.8% |
| Immigrants | Bulgaria | 94.1 /100 | #123 | Exceptional 75.8% |
| Immigrants | Sierra Leone | 93.8 /100 | #124 | Exceptional 75.8% |
| Immigrants | Scotland | 93.7 /100 | #125 | Exceptional 75.8% |
| Brazilians | 93.0 /100 | #126 | Exceptional 75.8% |
| Sub-Saharan Africans | 90.9 /100 | #127 | Exceptional 75.7% |
| Immigrants | Afghanistan | 89.4 /100 | #128 | Excellent 75.6% |
| Iroquois | 89.1 /100 | #129 | Excellent 75.6% |
| Immigrants | Austria | 88.8 /100 | #130 | Excellent 75.6% |