Immigrants from Ethiopia vs Immigrants from Colombia In Labor Force | Age 20-24
COMPARE
Immigrants from Ethiopia
Immigrants from Colombia
In Labor Force | Age 20-24
In Labor Force | Age 20-24 Comparison
Immigrants from Ethiopia
Immigrants from Colombia
77.5%
IN LABOR FORCE | AGE 20-24
100.0/ 100
METRIC RATING
33rd/ 347
METRIC RANK
73.4%
IN LABOR FORCE | AGE 20-24
0.2/ 100
METRIC RATING
274th/ 347
METRIC RANK
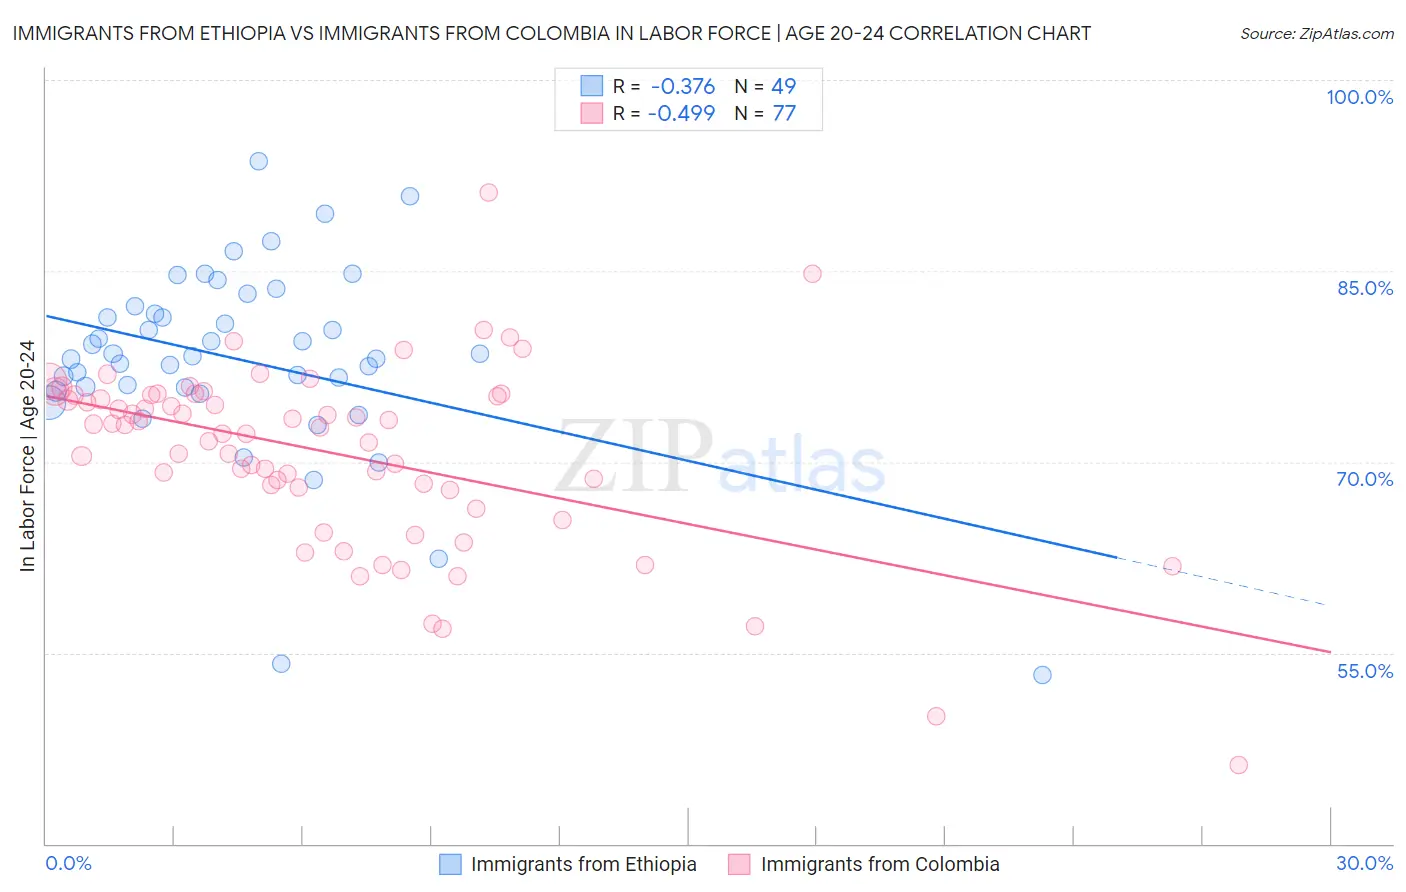
Immigrants from Ethiopia vs Immigrants from Colombia In Labor Force | Age 20-24 Correlation Chart
The statistical analysis conducted on geographies consisting of 211,552,880 people shows a mild negative correlation between the proportion of Immigrants from Ethiopia and labor force participation rate among population between the ages 20 and 24 in the United States with a correlation coefficient (R) of -0.376 and weighted average of 77.5%. Similarly, the statistical analysis conducted on geographies consisting of 378,565,425 people shows a moderate negative correlation between the proportion of Immigrants from Colombia and labor force participation rate among population between the ages 20 and 24 in the United States with a correlation coefficient (R) of -0.499 and weighted average of 73.4%, a difference of 5.6%.
In Labor Force | Age 20-24 Correlation Summary
| Measurement | Immigrants from Ethiopia | Immigrants from Colombia |
| Minimum | 53.3% | 46.2% |
| Maximum | 93.6% | 91.2% |
| Range | 40.3% | 45.0% |
| Mean | 78.0% | 70.7% |
| Median | 78.3% | 72.7% |
| Interquartile 25% (IQ1) | 75.7% | 67.9% |
| Interquartile 75% (IQ3) | 81.9% | 75.2% |
| Interquartile Range (IQR) | 6.2% | 7.3% |
| Standard Deviation (Sample) | 7.6% | 7.3% |
| Standard Deviation (Population) | 7.5% | 7.2% |
Similar Demographics by In Labor Force | Age 20-24
Demographics Similar to Immigrants from Ethiopia by In Labor Force | Age 20-24
In terms of in labor force | age 20-24, the demographic groups most similar to Immigrants from Ethiopia are German Russian (77.5%, a difference of 0.010%), Immigrants from Eastern Africa (77.5%, a difference of 0.020%), Welsh (77.5%, a difference of 0.040%), English (77.6%, a difference of 0.050%), and Czechoslovakian (77.5%, a difference of 0.050%).
| Demographics | Rating | Rank | In Labor Force | Age 20-24 |
| Tongans | 100.0 /100 | #26 | Exceptional 77.9% |
| Immigrants | Micronesia | 100.0 /100 | #27 | Exceptional 77.8% |
| Belgians | 100.0 /100 | #28 | Exceptional 77.8% |
| Slovaks | 100.0 /100 | #29 | Exceptional 77.7% |
| Swiss | 100.0 /100 | #30 | Exceptional 77.7% |
| Poles | 100.0 /100 | #31 | Exceptional 77.6% |
| English | 100.0 /100 | #32 | Exceptional 77.6% |
| Immigrants | Ethiopia | 100.0 /100 | #33 | Exceptional 77.5% |
| German Russians | 100.0 /100 | #34 | Exceptional 77.5% |
| Immigrants | Eastern Africa | 100.0 /100 | #35 | Exceptional 77.5% |
| Welsh | 100.0 /100 | #36 | Exceptional 77.5% |
| Czechoslovakians | 100.0 /100 | #37 | Exceptional 77.5% |
| Marshallese | 100.0 /100 | #38 | Exceptional 77.4% |
| Irish | 100.0 /100 | #39 | Exceptional 77.4% |
| Scottish | 100.0 /100 | #40 | Exceptional 77.4% |
Demographics Similar to Immigrants from Colombia by In Labor Force | Age 20-24
In terms of in labor force | age 20-24, the demographic groups most similar to Immigrants from Colombia are Cheyenne (73.4%, a difference of 0.020%), Belizean (73.4%, a difference of 0.050%), Immigrants from South America (73.3%, a difference of 0.050%), Immigrants from Indonesia (73.4%, a difference of 0.060%), and Mongolian (73.3%, a difference of 0.070%).
| Demographics | Rating | Rank | In Labor Force | Age 20-24 |
| Immigrants | Western Asia | 0.4 /100 | #267 | Tragic 73.5% |
| South Americans | 0.4 /100 | #268 | Tragic 73.5% |
| Colombians | 0.3 /100 | #269 | Tragic 73.5% |
| Immigrants | Russia | 0.3 /100 | #270 | Tragic 73.5% |
| Immigrants | Indonesia | 0.3 /100 | #271 | Tragic 73.4% |
| Belizeans | 0.3 /100 | #272 | Tragic 73.4% |
| Cheyenne | 0.2 /100 | #273 | Tragic 73.4% |
| Immigrants | Colombia | 0.2 /100 | #274 | Tragic 73.4% |
| Immigrants | South America | 0.2 /100 | #275 | Tragic 73.3% |
| Mongolians | 0.2 /100 | #276 | Tragic 73.3% |
| Immigrants | Malaysia | 0.2 /100 | #277 | Tragic 73.3% |
| Cypriots | 0.2 /100 | #278 | Tragic 73.3% |
| Venezuelans | 0.2 /100 | #279 | Tragic 73.3% |
| Bahamians | 0.1 /100 | #280 | Tragic 73.3% |
| Immigrants | Venezuela | 0.1 /100 | #281 | Tragic 73.2% |