Immigrants from Ethiopia vs Immigrants from China In Labor Force | Age 20-24
COMPARE
Immigrants from Ethiopia
Immigrants from China
In Labor Force | Age 20-24
In Labor Force | Age 20-24 Comparison
Immigrants from Ethiopia
Immigrants from China
77.5%
IN LABOR FORCE | AGE 20-24
100.0/ 100
METRIC RATING
33rd/ 347
METRIC RANK
71.1%
IN LABOR FORCE | AGE 20-24
0.0/ 100
METRIC RATING
328th/ 347
METRIC RANK
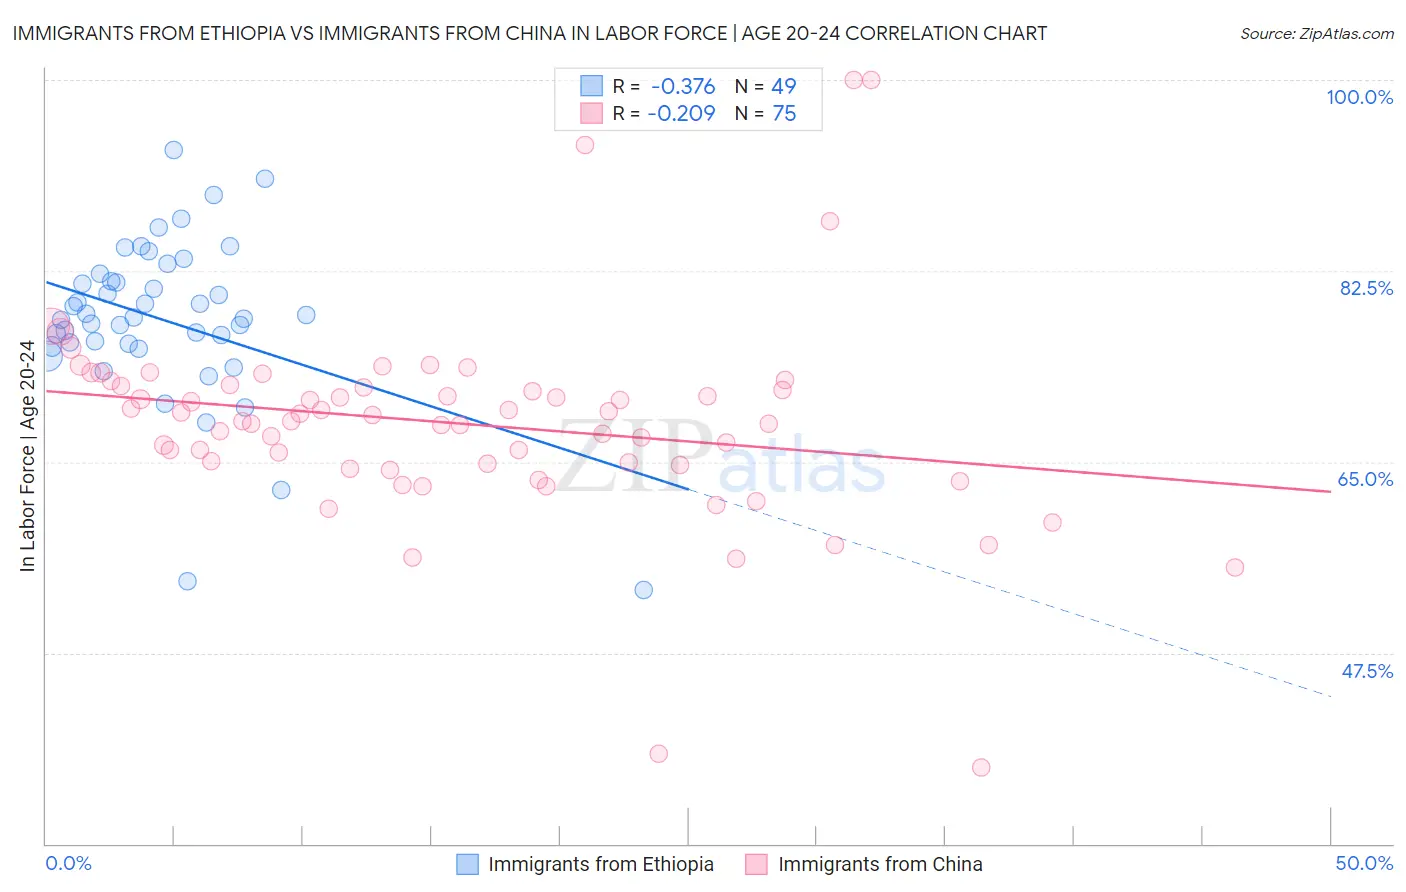
Immigrants from Ethiopia vs Immigrants from China In Labor Force | Age 20-24 Correlation Chart
The statistical analysis conducted on geographies consisting of 211,552,880 people shows a mild negative correlation between the proportion of Immigrants from Ethiopia and labor force participation rate among population between the ages 20 and 24 in the United States with a correlation coefficient (R) of -0.376 and weighted average of 77.5%. Similarly, the statistical analysis conducted on geographies consisting of 456,875,563 people shows a weak negative correlation between the proportion of Immigrants from China and labor force participation rate among population between the ages 20 and 24 in the United States with a correlation coefficient (R) of -0.209 and weighted average of 71.1%, a difference of 9.1%.
In Labor Force | Age 20-24 Correlation Summary
| Measurement | Immigrants from Ethiopia | Immigrants from China |
| Minimum | 53.3% | 37.0% |
| Maximum | 93.6% | 100.0% |
| Range | 40.3% | 63.0% |
| Mean | 78.0% | 68.5% |
| Median | 78.3% | 68.8% |
| Interquartile 25% (IQ1) | 75.7% | 64.7% |
| Interquartile 75% (IQ3) | 81.9% | 71.9% |
| Interquartile Range (IQR) | 6.2% | 7.3% |
| Standard Deviation (Sample) | 7.6% | 9.5% |
| Standard Deviation (Population) | 7.5% | 9.4% |
Similar Demographics by In Labor Force | Age 20-24
Demographics Similar to Immigrants from Ethiopia by In Labor Force | Age 20-24
In terms of in labor force | age 20-24, the demographic groups most similar to Immigrants from Ethiopia are German Russian (77.5%, a difference of 0.010%), Immigrants from Eastern Africa (77.5%, a difference of 0.020%), Welsh (77.5%, a difference of 0.040%), English (77.6%, a difference of 0.050%), and Czechoslovakian (77.5%, a difference of 0.050%).
| Demographics | Rating | Rank | In Labor Force | Age 20-24 |
| Tongans | 100.0 /100 | #26 | Exceptional 77.9% |
| Immigrants | Micronesia | 100.0 /100 | #27 | Exceptional 77.8% |
| Belgians | 100.0 /100 | #28 | Exceptional 77.8% |
| Slovaks | 100.0 /100 | #29 | Exceptional 77.7% |
| Swiss | 100.0 /100 | #30 | Exceptional 77.7% |
| Poles | 100.0 /100 | #31 | Exceptional 77.6% |
| English | 100.0 /100 | #32 | Exceptional 77.6% |
| Immigrants | Ethiopia | 100.0 /100 | #33 | Exceptional 77.5% |
| German Russians | 100.0 /100 | #34 | Exceptional 77.5% |
| Immigrants | Eastern Africa | 100.0 /100 | #35 | Exceptional 77.5% |
| Welsh | 100.0 /100 | #36 | Exceptional 77.5% |
| Czechoslovakians | 100.0 /100 | #37 | Exceptional 77.5% |
| Marshallese | 100.0 /100 | #38 | Exceptional 77.4% |
| Irish | 100.0 /100 | #39 | Exceptional 77.4% |
| Scottish | 100.0 /100 | #40 | Exceptional 77.4% |
Demographics Similar to Immigrants from China by In Labor Force | Age 20-24
In terms of in labor force | age 20-24, the demographic groups most similar to Immigrants from China are Dominican (71.1%, a difference of 0.020%), Immigrants from Trinidad and Tobago (71.1%, a difference of 0.020%), Barbadian (71.1%, a difference of 0.10%), Immigrants from Dominican Republic (71.2%, a difference of 0.21%), and Yup'ik (70.9%, a difference of 0.24%).
| Demographics | Rating | Rank | In Labor Force | Age 20-24 |
| Immigrants | Taiwan | 0.0 /100 | #321 | Tragic 71.5% |
| Filipinos | 0.0 /100 | #322 | Tragic 71.4% |
| West Indians | 0.0 /100 | #323 | Tragic 71.3% |
| Immigrants | Dominican Republic | 0.0 /100 | #324 | Tragic 71.2% |
| Barbadians | 0.0 /100 | #325 | Tragic 71.1% |
| Dominicans | 0.0 /100 | #326 | Tragic 71.1% |
| Immigrants | Trinidad and Tobago | 0.0 /100 | #327 | Tragic 71.1% |
| Immigrants | China | 0.0 /100 | #328 | Tragic 71.1% |
| Yup'ik | 0.0 /100 | #329 | Tragic 70.9% |
| Vietnamese | 0.0 /100 | #330 | Tragic 70.6% |
| Immigrants | Bangladesh | 0.0 /100 | #331 | Tragic 70.6% |
| Immigrants | Uzbekistan | 0.0 /100 | #332 | Tragic 70.4% |
| Yuman | 0.0 /100 | #333 | Tragic 70.3% |
| British West Indians | 0.0 /100 | #334 | Tragic 70.0% |
| Immigrants | Barbados | 0.0 /100 | #335 | Tragic 69.7% |