Immigrants from Singapore vs Immigrants from Colombia In Labor Force | Age 20-24
COMPARE
Immigrants from Singapore
Immigrants from Colombia
In Labor Force | Age 20-24
In Labor Force | Age 20-24 Comparison
Immigrants from Singapore
Immigrants from Colombia
72.4%
IN LABOR FORCE | AGE 20-24
0.0/ 100
METRIC RATING
305th/ 347
METRIC RANK
73.4%
IN LABOR FORCE | AGE 20-24
0.2/ 100
METRIC RATING
274th/ 347
METRIC RANK
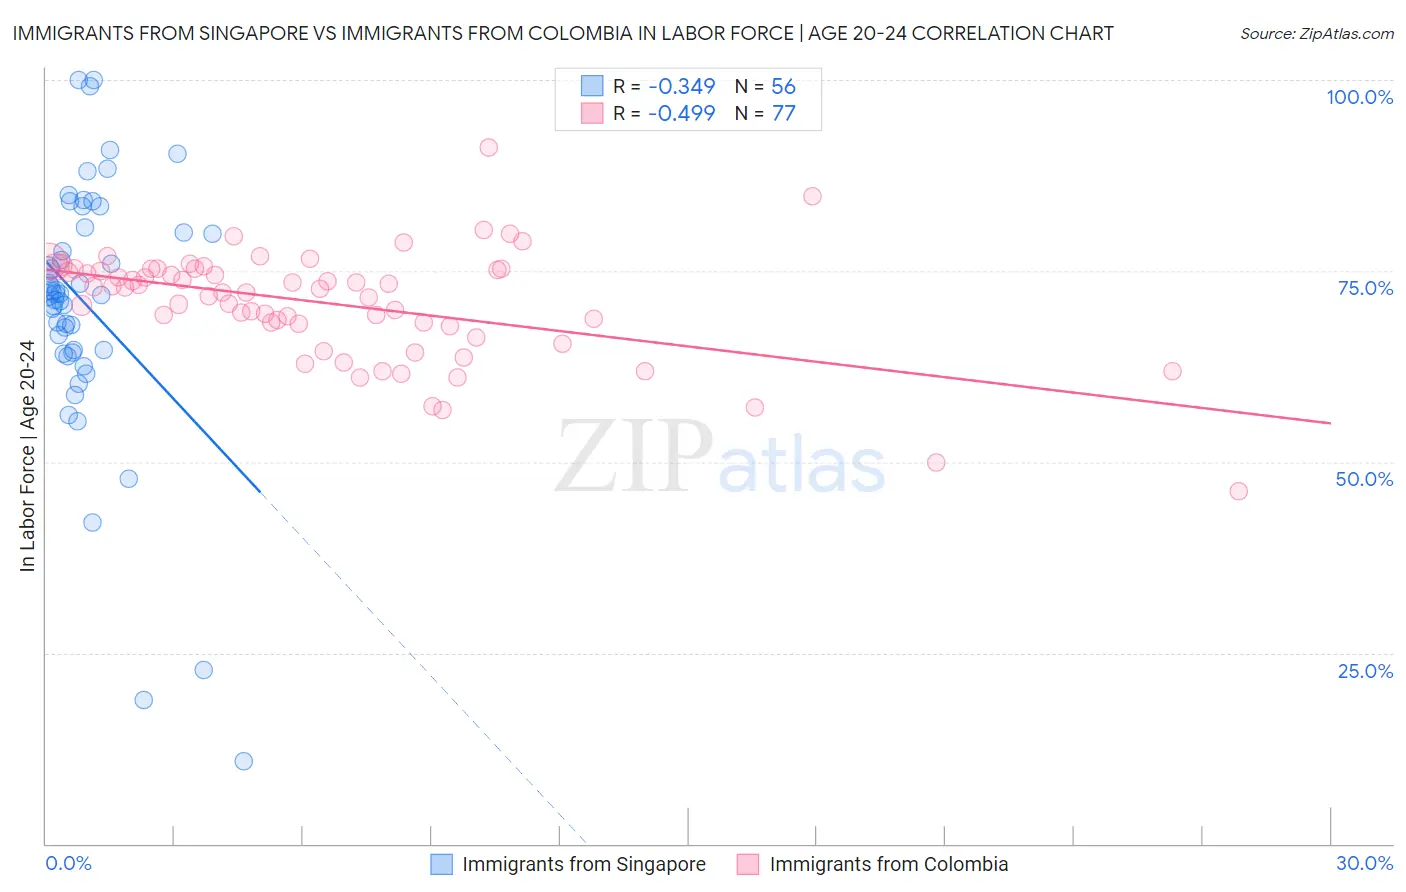
Immigrants from Singapore vs Immigrants from Colombia In Labor Force | Age 20-24 Correlation Chart
The statistical analysis conducted on geographies consisting of 137,517,565 people shows a mild negative correlation between the proportion of Immigrants from Singapore and labor force participation rate among population between the ages 20 and 24 in the United States with a correlation coefficient (R) of -0.349 and weighted average of 72.4%. Similarly, the statistical analysis conducted on geographies consisting of 378,565,425 people shows a moderate negative correlation between the proportion of Immigrants from Colombia and labor force participation rate among population between the ages 20 and 24 in the United States with a correlation coefficient (R) of -0.499 and weighted average of 73.4%, a difference of 1.4%.
In Labor Force | Age 20-24 Correlation Summary
| Measurement | Immigrants from Singapore | Immigrants from Colombia |
| Minimum | 10.8% | 46.2% |
| Maximum | 100.0% | 91.2% |
| Range | 89.2% | 45.0% |
| Mean | 70.4% | 70.7% |
| Median | 71.9% | 72.7% |
| Interquartile 25% (IQ1) | 64.5% | 67.9% |
| Interquartile 75% (IQ3) | 80.3% | 75.2% |
| Interquartile Range (IQR) | 15.9% | 7.3% |
| Standard Deviation (Sample) | 17.3% | 7.3% |
| Standard Deviation (Population) | 17.2% | 7.2% |
Similar Demographics by In Labor Force | Age 20-24
Demographics Similar to Immigrants from Singapore by In Labor Force | Age 20-24
In terms of in labor force | age 20-24, the demographic groups most similar to Immigrants from Singapore are Immigrants from Jamaica (72.4%, a difference of 0.020%), Immigrants from West Indies (72.4%, a difference of 0.030%), Ecuadorian (72.4%, a difference of 0.040%), Native/Alaskan (72.4%, a difference of 0.050%), and Cuban (72.5%, a difference of 0.14%).
| Demographics | Rating | Rank | In Labor Force | Age 20-24 |
| Israelis | 0.0 /100 | #298 | Tragic 72.6% |
| Iranians | 0.0 /100 | #299 | Tragic 72.6% |
| Armenians | 0.0 /100 | #300 | Tragic 72.5% |
| Cubans | 0.0 /100 | #301 | Tragic 72.5% |
| Natives/Alaskans | 0.0 /100 | #302 | Tragic 72.4% |
| Ecuadorians | 0.0 /100 | #303 | Tragic 72.4% |
| Immigrants | West Indies | 0.0 /100 | #304 | Tragic 72.4% |
| Immigrants | Singapore | 0.0 /100 | #305 | Tragic 72.4% |
| Immigrants | Jamaica | 0.0 /100 | #306 | Tragic 72.4% |
| Immigrants | Ecuador | 0.0 /100 | #307 | Tragic 72.3% |
| Soviet Union | 0.0 /100 | #308 | Tragic 72.3% |
| Tsimshian | 0.0 /100 | #309 | Tragic 72.3% |
| Immigrants | Cuba | 0.0 /100 | #310 | Tragic 72.0% |
| Apache | 0.0 /100 | #311 | Tragic 72.0% |
| Immigrants | Caribbean | 0.0 /100 | #312 | Tragic 71.9% |
Demographics Similar to Immigrants from Colombia by In Labor Force | Age 20-24
In terms of in labor force | age 20-24, the demographic groups most similar to Immigrants from Colombia are Cheyenne (73.4%, a difference of 0.020%), Belizean (73.4%, a difference of 0.050%), Immigrants from South America (73.3%, a difference of 0.050%), Immigrants from Indonesia (73.4%, a difference of 0.060%), and Mongolian (73.3%, a difference of 0.070%).
| Demographics | Rating | Rank | In Labor Force | Age 20-24 |
| Immigrants | Western Asia | 0.4 /100 | #267 | Tragic 73.5% |
| South Americans | 0.4 /100 | #268 | Tragic 73.5% |
| Colombians | 0.3 /100 | #269 | Tragic 73.5% |
| Immigrants | Russia | 0.3 /100 | #270 | Tragic 73.5% |
| Immigrants | Indonesia | 0.3 /100 | #271 | Tragic 73.4% |
| Belizeans | 0.3 /100 | #272 | Tragic 73.4% |
| Cheyenne | 0.2 /100 | #273 | Tragic 73.4% |
| Immigrants | Colombia | 0.2 /100 | #274 | Tragic 73.4% |
| Immigrants | South America | 0.2 /100 | #275 | Tragic 73.3% |
| Mongolians | 0.2 /100 | #276 | Tragic 73.3% |
| Immigrants | Malaysia | 0.2 /100 | #277 | Tragic 73.3% |
| Cypriots | 0.2 /100 | #278 | Tragic 73.3% |
| Venezuelans | 0.2 /100 | #279 | Tragic 73.3% |
| Bahamians | 0.1 /100 | #280 | Tragic 73.3% |
| Immigrants | Venezuela | 0.1 /100 | #281 | Tragic 73.2% |