Iroquois vs Immigrants from Colombia In Labor Force | Age 20-24
COMPARE
Iroquois
Immigrants from Colombia
In Labor Force | Age 20-24
In Labor Force | Age 20-24 Comparison
Iroquois
Immigrants from Colombia
75.6%
IN LABOR FORCE | AGE 20-24
89.1/ 100
METRIC RATING
129th/ 347
METRIC RANK
73.4%
IN LABOR FORCE | AGE 20-24
0.2/ 100
METRIC RATING
274th/ 347
METRIC RANK
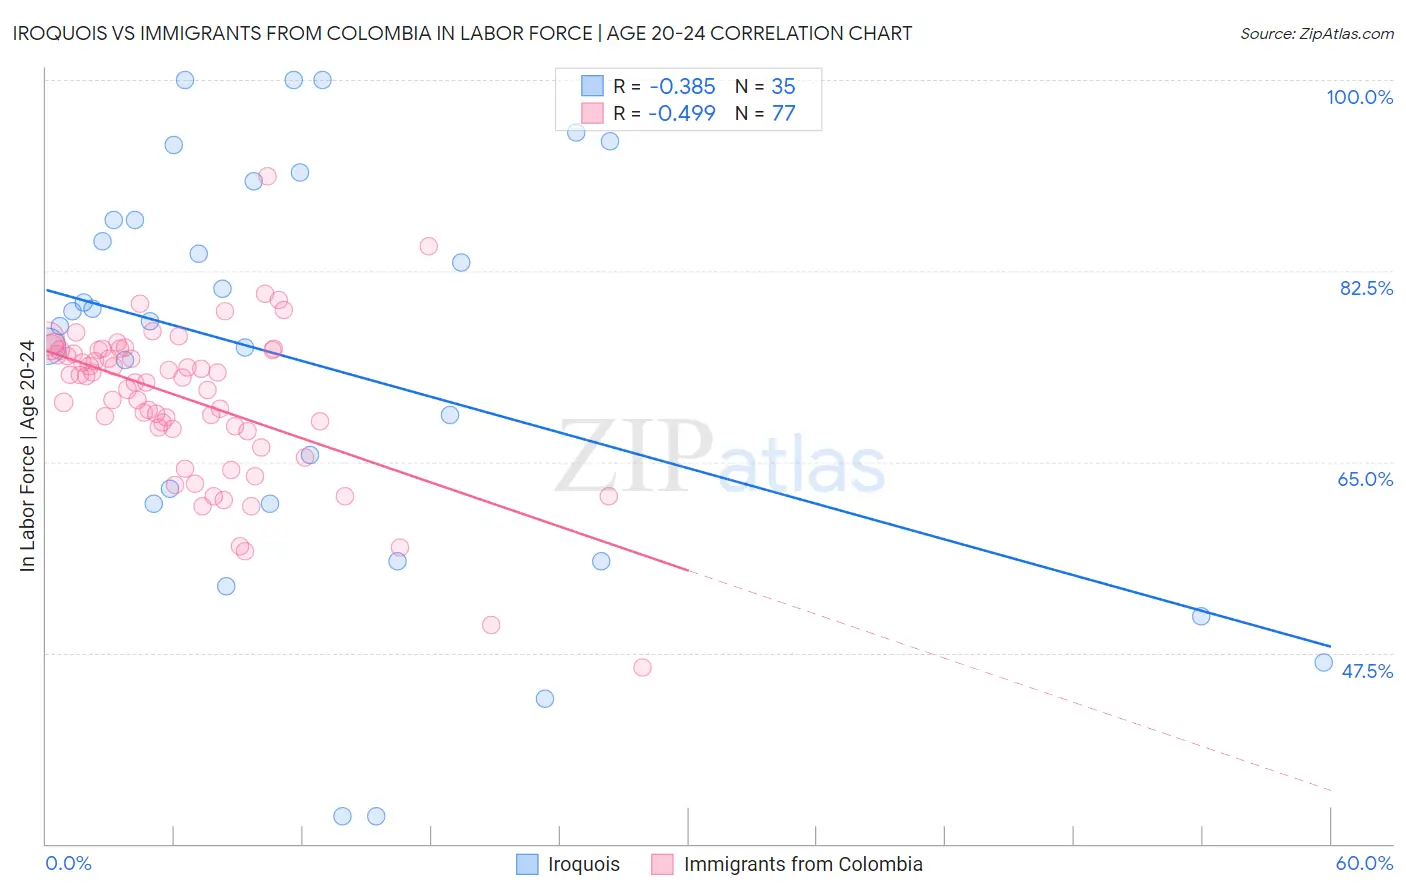
Iroquois vs Immigrants from Colombia In Labor Force | Age 20-24 Correlation Chart
The statistical analysis conducted on geographies consisting of 207,263,763 people shows a mild negative correlation between the proportion of Iroquois and labor force participation rate among population between the ages 20 and 24 in the United States with a correlation coefficient (R) of -0.385 and weighted average of 75.6%. Similarly, the statistical analysis conducted on geographies consisting of 378,565,425 people shows a moderate negative correlation between the proportion of Immigrants from Colombia and labor force participation rate among population between the ages 20 and 24 in the United States with a correlation coefficient (R) of -0.499 and weighted average of 73.4%, a difference of 3.1%.
In Labor Force | Age 20-24 Correlation Summary
| Measurement | Iroquois | Immigrants from Colombia |
| Minimum | 32.5% | 46.2% |
| Maximum | 100.0% | 91.2% |
| Range | 67.5% | 45.0% |
| Mean | 73.8% | 70.7% |
| Median | 77.9% | 72.7% |
| Interquartile 25% (IQ1) | 61.2% | 67.9% |
| Interquartile 75% (IQ3) | 87.2% | 75.2% |
| Interquartile Range (IQR) | 26.0% | 7.3% |
| Standard Deviation (Sample) | 18.8% | 7.3% |
| Standard Deviation (Population) | 18.5% | 7.2% |
Similar Demographics by In Labor Force | Age 20-24
Demographics Similar to Iroquois by In Labor Force | Age 20-24
In terms of in labor force | age 20-24, the demographic groups most similar to Iroquois are Immigrants from Afghanistan (75.6%, a difference of 0.010%), Immigrants from Austria (75.6%, a difference of 0.010%), Immigrants from Jordan (75.6%, a difference of 0.020%), Palestinian (75.6%, a difference of 0.020%), and Zimbabwean (75.6%, a difference of 0.030%).
| Demographics | Rating | Rank | In Labor Force | Age 20-24 |
| Pakistanis | 94.1 /100 | #122 | Exceptional 75.8% |
| Immigrants | Bulgaria | 94.1 /100 | #123 | Exceptional 75.8% |
| Immigrants | Sierra Leone | 93.8 /100 | #124 | Exceptional 75.8% |
| Immigrants | Scotland | 93.7 /100 | #125 | Exceptional 75.8% |
| Brazilians | 93.0 /100 | #126 | Exceptional 75.8% |
| Sub-Saharan Africans | 90.9 /100 | #127 | Exceptional 75.7% |
| Immigrants | Afghanistan | 89.4 /100 | #128 | Excellent 75.6% |
| Iroquois | 89.1 /100 | #129 | Excellent 75.6% |
| Immigrants | Austria | 88.8 /100 | #130 | Excellent 75.6% |
| Immigrants | Jordan | 88.5 /100 | #131 | Excellent 75.6% |
| Palestinians | 88.4 /100 | #132 | Excellent 75.6% |
| Zimbabweans | 88.2 /100 | #133 | Excellent 75.6% |
| Estonians | 87.1 /100 | #134 | Excellent 75.6% |
| Yaqui | 85.5 /100 | #135 | Excellent 75.5% |
| Immigrants | Brazil | 84.8 /100 | #136 | Excellent 75.5% |
Demographics Similar to Immigrants from Colombia by In Labor Force | Age 20-24
In terms of in labor force | age 20-24, the demographic groups most similar to Immigrants from Colombia are Cheyenne (73.4%, a difference of 0.020%), Belizean (73.4%, a difference of 0.050%), Immigrants from South America (73.3%, a difference of 0.050%), Immigrants from Indonesia (73.4%, a difference of 0.060%), and Mongolian (73.3%, a difference of 0.070%).
| Demographics | Rating | Rank | In Labor Force | Age 20-24 |
| Immigrants | Western Asia | 0.4 /100 | #267 | Tragic 73.5% |
| South Americans | 0.4 /100 | #268 | Tragic 73.5% |
| Colombians | 0.3 /100 | #269 | Tragic 73.5% |
| Immigrants | Russia | 0.3 /100 | #270 | Tragic 73.5% |
| Immigrants | Indonesia | 0.3 /100 | #271 | Tragic 73.4% |
| Belizeans | 0.3 /100 | #272 | Tragic 73.4% |
| Cheyenne | 0.2 /100 | #273 | Tragic 73.4% |
| Immigrants | Colombia | 0.2 /100 | #274 | Tragic 73.4% |
| Immigrants | South America | 0.2 /100 | #275 | Tragic 73.3% |
| Mongolians | 0.2 /100 | #276 | Tragic 73.3% |
| Immigrants | Malaysia | 0.2 /100 | #277 | Tragic 73.3% |
| Cypriots | 0.2 /100 | #278 | Tragic 73.3% |
| Venezuelans | 0.2 /100 | #279 | Tragic 73.3% |
| Bahamians | 0.1 /100 | #280 | Tragic 73.3% |
| Immigrants | Venezuela | 0.1 /100 | #281 | Tragic 73.2% |