Immigrants from Egypt vs Immigrants from Bahamas In Labor Force | Age 16-19
COMPARE
Immigrants from Egypt
Immigrants from Bahamas
In Labor Force | Age 16-19
In Labor Force | Age 16-19 Comparison
Immigrants from Egypt
Immigrants from Bahamas
34.6%
IN LABOR FORCE | AGE 16-19
1.2/ 100
METRIC RATING
257th/ 347
METRIC RANK
35.5%
IN LABOR FORCE | AGE 16-19
8.3/ 100
METRIC RATING
220th/ 347
METRIC RANK
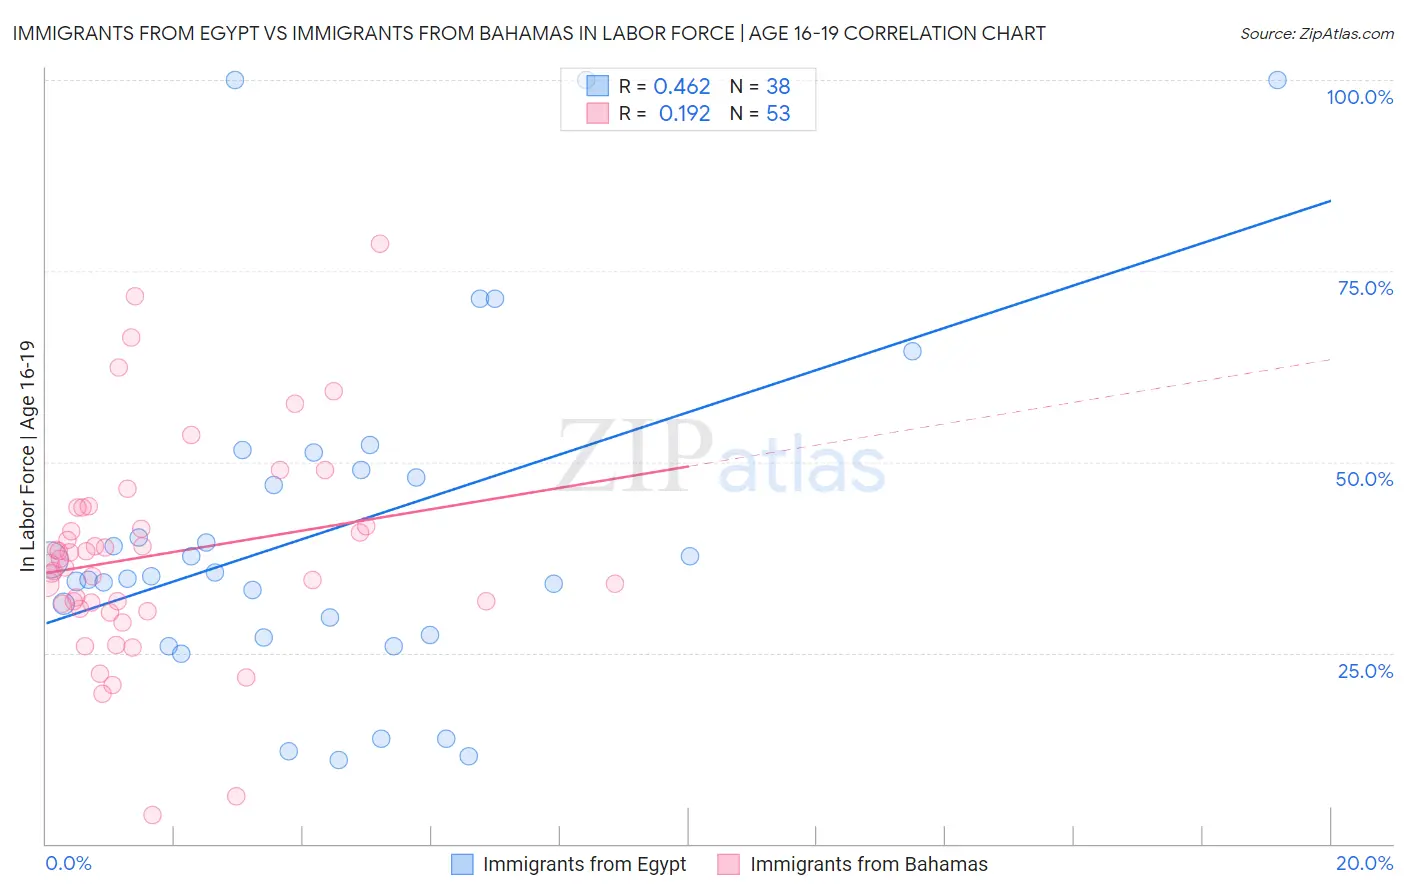
Immigrants from Egypt vs Immigrants from Bahamas In Labor Force | Age 16-19 Correlation Chart
The statistical analysis conducted on geographies consisting of 245,278,440 people shows a moderate positive correlation between the proportion of Immigrants from Egypt and labor force participation rate among population between the ages 16 and 19 in the United States with a correlation coefficient (R) of 0.462 and weighted average of 34.6%. Similarly, the statistical analysis conducted on geographies consisting of 104,625,160 people shows a poor positive correlation between the proportion of Immigrants from Bahamas and labor force participation rate among population between the ages 16 and 19 in the United States with a correlation coefficient (R) of 0.192 and weighted average of 35.5%, a difference of 2.6%.
In Labor Force | Age 16-19 Correlation Summary
| Measurement | Immigrants from Egypt | Immigrants from Bahamas |
| Minimum | 11.0% | 3.8% |
| Maximum | 100.0% | 78.5% |
| Range | 89.0% | 74.7% |
| Mean | 41.2% | 37.8% |
| Median | 35.3% | 36.7% |
| Interquartile 25% (IQ1) | 27.4% | 31.1% |
| Interquartile 75% (IQ3) | 48.9% | 42.7% |
| Interquartile Range (IQR) | 21.5% | 11.6% |
| Standard Deviation (Sample) | 22.7% | 13.9% |
| Standard Deviation (Population) | 22.4% | 13.7% |
Similar Demographics by In Labor Force | Age 16-19
Demographics Similar to Immigrants from Egypt by In Labor Force | Age 16-19
In terms of in labor force | age 16-19, the demographic groups most similar to Immigrants from Egypt are Immigrants from South Central Asia (34.6%, a difference of 0.010%), Thai (34.6%, a difference of 0.010%), Immigrants (34.6%, a difference of 0.020%), Egyptian (34.5%, a difference of 0.10%), and Peruvian (34.6%, a difference of 0.11%).
| Demographics | Rating | Rank | In Labor Force | Age 16-19 |
| Immigrants | Pakistan | 2.0 /100 | #250 | Tragic 34.8% |
| Immigrants | Western Asia | 2.0 /100 | #251 | Tragic 34.8% |
| Immigrants | Chile | 2.0 /100 | #252 | Tragic 34.8% |
| Immigrants | Japan | 1.5 /100 | #253 | Tragic 34.7% |
| Bahamians | 1.4 /100 | #254 | Tragic 34.6% |
| Peruvians | 1.4 /100 | #255 | Tragic 34.6% |
| Immigrants | South Central Asia | 1.3 /100 | #256 | Tragic 34.6% |
| Immigrants | Egypt | 1.2 /100 | #257 | Tragic 34.6% |
| Thais | 1.2 /100 | #258 | Tragic 34.6% |
| Immigrants | Immigrants | 1.2 /100 | #259 | Tragic 34.6% |
| Egyptians | 1.2 /100 | #260 | Tragic 34.5% |
| Salvadorans | 1.1 /100 | #261 | Tragic 34.5% |
| Hispanics or Latinos | 1.1 /100 | #262 | Tragic 34.5% |
| Burmese | 1.1 /100 | #263 | Tragic 34.5% |
| Immigrants | Uruguay | 0.9 /100 | #264 | Tragic 34.4% |
Demographics Similar to Immigrants from Bahamas by In Labor Force | Age 16-19
In terms of in labor force | age 16-19, the demographic groups most similar to Immigrants from Bahamas are Guatemalan (35.5%, a difference of 0.060%), Turkish (35.4%, a difference of 0.18%), Immigrants from Ghana (35.4%, a difference of 0.19%), Sri Lankan (35.5%, a difference of 0.24%), and Ghanaian (35.3%, a difference of 0.33%).
| Demographics | Rating | Rank | In Labor Force | Age 16-19 |
| Immigrants | Bolivia | 11.0 /100 | #213 | Poor 35.6% |
| Apache | 11.0 /100 | #214 | Poor 35.6% |
| Immigrants | South Eastern Asia | 10.8 /100 | #215 | Poor 35.6% |
| Dutch West Indians | 10.7 /100 | #216 | Poor 35.6% |
| Immigrants | Costa Rica | 10.7 /100 | #217 | Poor 35.6% |
| Sri Lankans | 9.8 /100 | #218 | Tragic 35.5% |
| Guatemalans | 8.6 /100 | #219 | Tragic 35.5% |
| Immigrants | Bahamas | 8.3 /100 | #220 | Tragic 35.5% |
| Turks | 7.3 /100 | #221 | Tragic 35.4% |
| Immigrants | Ghana | 7.3 /100 | #222 | Tragic 35.4% |
| Ghanaians | 6.5 /100 | #223 | Tragic 35.3% |
| Hondurans | 6.5 /100 | #224 | Tragic 35.3% |
| Immigrants | Belgium | 6.1 /100 | #225 | Tragic 35.3% |
| Immigrants | Guatemala | 5.7 /100 | #226 | Tragic 35.3% |
| Mongolians | 5.7 /100 | #227 | Tragic 35.3% |