Immigrants from Egypt vs Immigrants from Bahamas Unemployment Among Ages 35 to 44 years
COMPARE
Immigrants from Egypt
Immigrants from Bahamas
Unemployment Among Ages 35 to 44 years
Unemployment Among Ages 35 to 44 years Comparison
Immigrants from Egypt
Immigrants from Bahamas
4.5%
UNEMPLOYMENT AMONG AGES 35 TO 44 YEARS
92.3/ 100
METRIC RATING
99th/ 347
METRIC RANK
5.2%
UNEMPLOYMENT AMONG AGES 35 TO 44 YEARS
0.2/ 100
METRIC RATING
254th/ 347
METRIC RANK
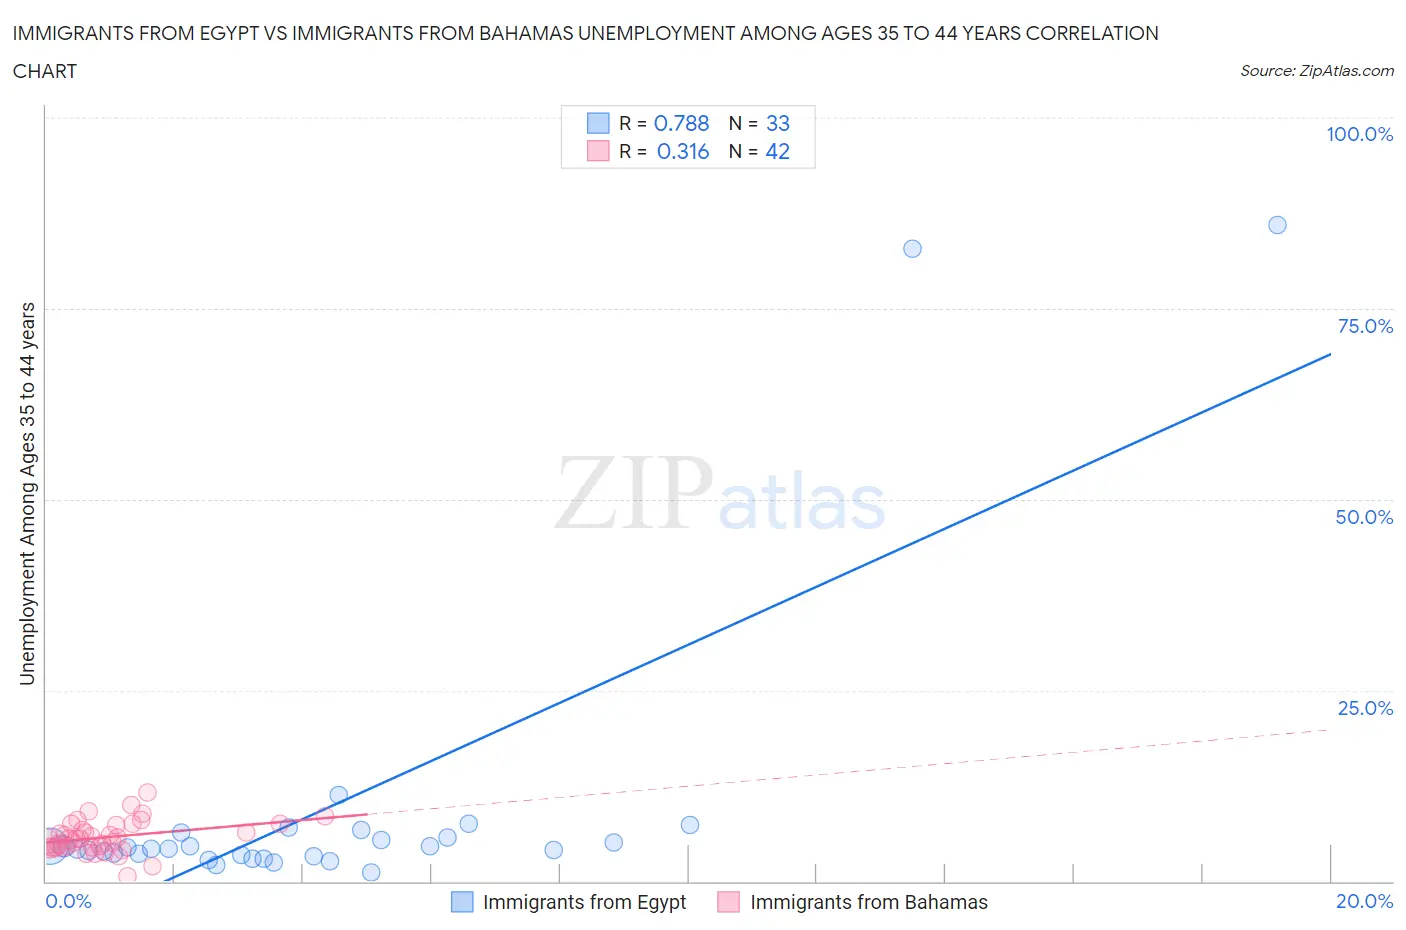
Immigrants from Egypt vs Immigrants from Bahamas Unemployment Among Ages 35 to 44 years Correlation Chart
The statistical analysis conducted on geographies consisting of 243,386,535 people shows a strong positive correlation between the proportion of Immigrants from Egypt and unemployment rate among population between the ages 35 and 44 in the United States with a correlation coefficient (R) of 0.788 and weighted average of 4.5%. Similarly, the statistical analysis conducted on geographies consisting of 103,893,363 people shows a mild positive correlation between the proportion of Immigrants from Bahamas and unemployment rate among population between the ages 35 and 44 in the United States with a correlation coefficient (R) of 0.316 and weighted average of 5.2%, a difference of 16.5%.
Unemployment Among Ages 35 to 44 years Correlation Summary
| Measurement | Immigrants from Egypt | Immigrants from Bahamas |
| Minimum | 1.1% | 0.70% |
| Maximum | 86.0% | 11.7% |
| Range | 84.9% | 11.0% |
| Mean | 9.4% | 5.8% |
| Median | 4.2% | 5.5% |
| Interquartile 25% (IQ1) | 3.3% | 4.4% |
| Interquartile 75% (IQ3) | 6.1% | 7.4% |
| Interquartile Range (IQR) | 2.8% | 3.0% |
| Standard Deviation (Sample) | 19.4% | 2.1% |
| Standard Deviation (Population) | 19.2% | 2.1% |
Similar Demographics by Unemployment Among Ages 35 to 44 years
Demographics Similar to Immigrants from Egypt by Unemployment Among Ages 35 to 44 years
In terms of unemployment among ages 35 to 44 years, the demographic groups most similar to Immigrants from Egypt are Immigrants from Canada (4.5%, a difference of 0.010%), Immigrants from France (4.5%, a difference of 0.060%), Italian (4.5%, a difference of 0.090%), Immigrants from Netherlands (4.5%, a difference of 0.10%), and Immigrants from Sudan (4.5%, a difference of 0.13%).
| Demographics | Rating | Rank | Unemployment Among Ages 35 to 44 years |
| Estonians | 94.3 /100 | #92 | Exceptional 4.5% |
| Iranians | 93.9 /100 | #93 | Exceptional 4.5% |
| Russians | 93.8 /100 | #94 | Exceptional 4.5% |
| Yugoslavians | 93.6 /100 | #95 | Exceptional 4.5% |
| Scottish | 93.5 /100 | #96 | Exceptional 4.5% |
| Immigrants | France | 92.5 /100 | #97 | Exceptional 4.5% |
| Immigrants | Canada | 92.3 /100 | #98 | Exceptional 4.5% |
| Immigrants | Egypt | 92.3 /100 | #99 | Exceptional 4.5% |
| Italians | 91.9 /100 | #100 | Exceptional 4.5% |
| Immigrants | Netherlands | 91.9 /100 | #101 | Exceptional 4.5% |
| Immigrants | Sudan | 91.8 /100 | #102 | Exceptional 4.5% |
| Welsh | 91.6 /100 | #103 | Exceptional 4.5% |
| Finns | 91.6 /100 | #104 | Exceptional 4.5% |
| Immigrants | Saudi Arabia | 91.3 /100 | #105 | Exceptional 4.5% |
| Immigrants | North America | 91.1 /100 | #106 | Exceptional 4.5% |
Demographics Similar to Immigrants from Bahamas by Unemployment Among Ages 35 to 44 years
In terms of unemployment among ages 35 to 44 years, the demographic groups most similar to Immigrants from Bahamas are Mexican American Indian (5.2%, a difference of 0.030%), Armenian (5.2%, a difference of 0.050%), Cherokee (5.2%, a difference of 0.050%), Comanche (5.2%, a difference of 0.18%), and Seminole (5.2%, a difference of 0.31%).
| Demographics | Rating | Rank | Unemployment Among Ages 35 to 44 years |
| Immigrants | Somalia | 0.3 /100 | #247 | Tragic 5.2% |
| Alsatians | 0.2 /100 | #248 | Tragic 5.2% |
| Immigrants | Liberia | 0.2 /100 | #249 | Tragic 5.2% |
| Immigrants | El Salvador | 0.2 /100 | #250 | Tragic 5.2% |
| Comanche | 0.2 /100 | #251 | Tragic 5.2% |
| Armenians | 0.2 /100 | #252 | Tragic 5.2% |
| Mexican American Indians | 0.2 /100 | #253 | Tragic 5.2% |
| Immigrants | Bahamas | 0.2 /100 | #254 | Tragic 5.2% |
| Cherokee | 0.2 /100 | #255 | Tragic 5.2% |
| Seminole | 0.1 /100 | #256 | Tragic 5.2% |
| Immigrants | Fiji | 0.1 /100 | #257 | Tragic 5.3% |
| Immigrants | Latin America | 0.1 /100 | #258 | Tragic 5.3% |
| Mexicans | 0.1 /100 | #259 | Tragic 5.3% |
| Sub-Saharan Africans | 0.1 /100 | #260 | Tragic 5.3% |
| Spanish Americans | 0.1 /100 | #261 | Tragic 5.3% |