Immigrants from Uganda vs Immigrants from Bahamas In Labor Force | Age 16-19
COMPARE
Immigrants from Uganda
Immigrants from Bahamas
In Labor Force | Age 16-19
In Labor Force | Age 16-19 Comparison
Immigrants from Uganda
Immigrants from Bahamas
39.2%
IN LABOR FORCE | AGE 16-19
99.7/ 100
METRIC RATING
84th/ 347
METRIC RANK
35.5%
IN LABOR FORCE | AGE 16-19
8.3/ 100
METRIC RATING
220th/ 347
METRIC RANK
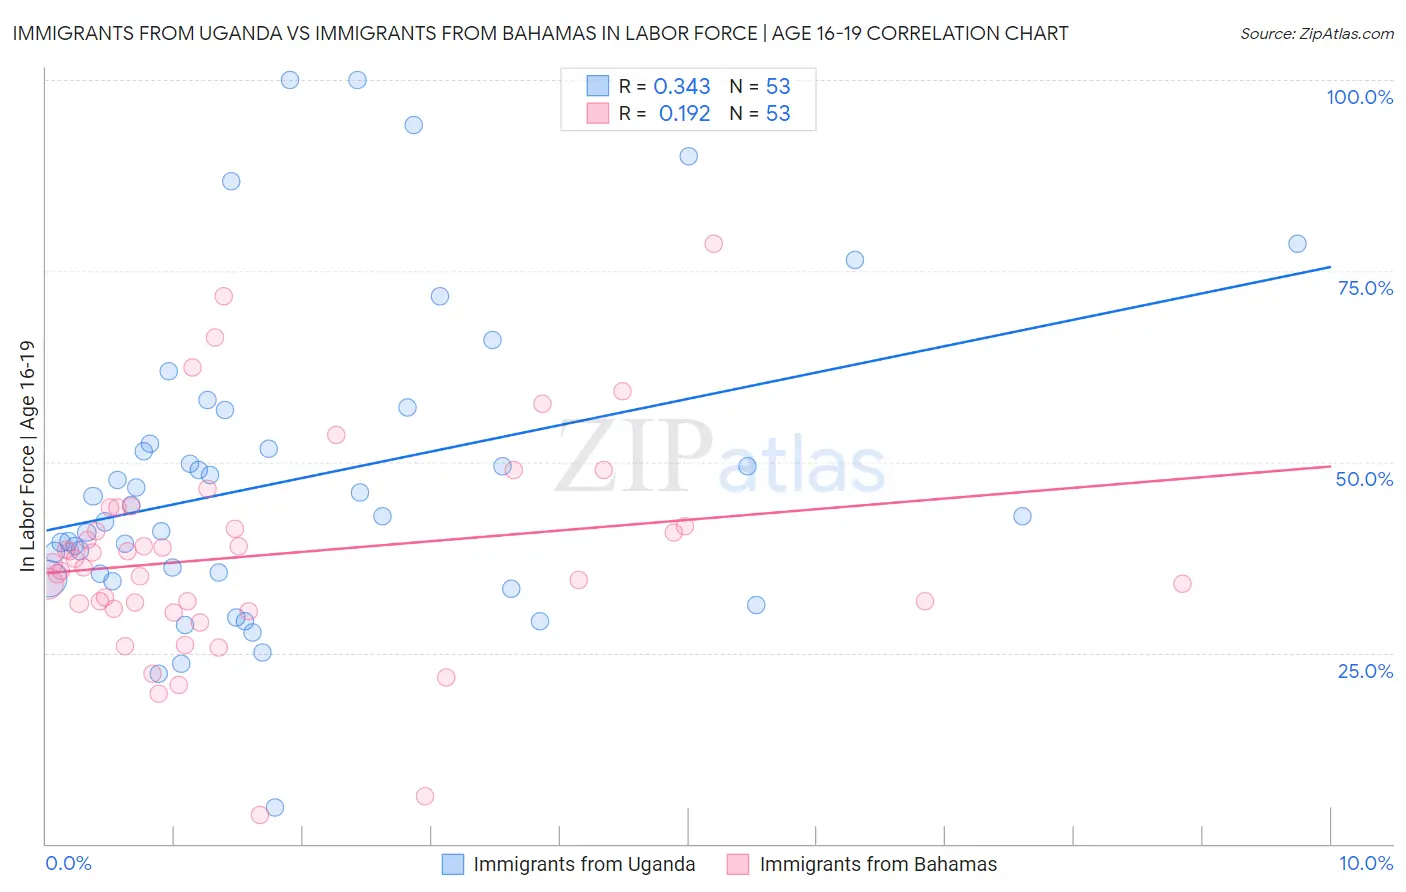
Immigrants from Uganda vs Immigrants from Bahamas In Labor Force | Age 16-19 Correlation Chart
The statistical analysis conducted on geographies consisting of 125,968,157 people shows a mild positive correlation between the proportion of Immigrants from Uganda and labor force participation rate among population between the ages 16 and 19 in the United States with a correlation coefficient (R) of 0.343 and weighted average of 39.2%. Similarly, the statistical analysis conducted on geographies consisting of 104,625,160 people shows a poor positive correlation between the proportion of Immigrants from Bahamas and labor force participation rate among population between the ages 16 and 19 in the United States with a correlation coefficient (R) of 0.192 and weighted average of 35.5%, a difference of 10.6%.
In Labor Force | Age 16-19 Correlation Summary
| Measurement | Immigrants from Uganda | Immigrants from Bahamas |
| Minimum | 4.7% | 3.8% |
| Maximum | 100.0% | 78.5% |
| Range | 95.3% | 74.7% |
| Mean | 47.8% | 37.8% |
| Median | 42.9% | 36.7% |
| Interquartile 25% (IQ1) | 35.0% | 31.1% |
| Interquartile 75% (IQ3) | 54.6% | 42.7% |
| Interquartile Range (IQR) | 19.6% | 11.6% |
| Standard Deviation (Sample) | 20.3% | 13.9% |
| Standard Deviation (Population) | 20.1% | 13.7% |
Similar Demographics by In Labor Force | Age 16-19
Demographics Similar to Immigrants from Uganda by In Labor Force | Age 16-19
In terms of in labor force | age 16-19, the demographic groups most similar to Immigrants from Uganda are Spanish (39.3%, a difference of 0.13%), Basque (39.3%, a difference of 0.15%), Creek (39.1%, a difference of 0.15%), Samoan (39.1%, a difference of 0.17%), and Shoshone (39.3%, a difference of 0.21%).
| Demographics | Rating | Rank | In Labor Force | Age 16-19 |
| Immigrants | Portugal | 99.9 /100 | #77 | Exceptional 39.7% |
| Austrians | 99.8 /100 | #78 | Exceptional 39.5% |
| Marshallese | 99.8 /100 | #79 | Exceptional 39.5% |
| Immigrants | Iraq | 99.8 /100 | #80 | Exceptional 39.4% |
| Shoshone | 99.7 /100 | #81 | Exceptional 39.3% |
| Basques | 99.7 /100 | #82 | Exceptional 39.3% |
| Spanish | 99.7 /100 | #83 | Exceptional 39.3% |
| Immigrants | Uganda | 99.7 /100 | #84 | Exceptional 39.2% |
| Creek | 99.6 /100 | #85 | Exceptional 39.1% |
| Samoans | 99.6 /100 | #86 | Exceptional 39.1% |
| Immigrants | Germany | 99.6 /100 | #87 | Exceptional 39.1% |
| Puget Sound Salish | 99.6 /100 | #88 | Exceptional 39.1% |
| Alaska Natives | 99.6 /100 | #89 | Exceptional 39.1% |
| Immigrants | Burma/Myanmar | 99.5 /100 | #90 | Exceptional 39.0% |
| Spanish Americans | 99.5 /100 | #91 | Exceptional 39.0% |
Demographics Similar to Immigrants from Bahamas by In Labor Force | Age 16-19
In terms of in labor force | age 16-19, the demographic groups most similar to Immigrants from Bahamas are Guatemalan (35.5%, a difference of 0.060%), Turkish (35.4%, a difference of 0.18%), Immigrants from Ghana (35.4%, a difference of 0.19%), Sri Lankan (35.5%, a difference of 0.24%), and Ghanaian (35.3%, a difference of 0.33%).
| Demographics | Rating | Rank | In Labor Force | Age 16-19 |
| Immigrants | Bolivia | 11.0 /100 | #213 | Poor 35.6% |
| Apache | 11.0 /100 | #214 | Poor 35.6% |
| Immigrants | South Eastern Asia | 10.8 /100 | #215 | Poor 35.6% |
| Dutch West Indians | 10.7 /100 | #216 | Poor 35.6% |
| Immigrants | Costa Rica | 10.7 /100 | #217 | Poor 35.6% |
| Sri Lankans | 9.8 /100 | #218 | Tragic 35.5% |
| Guatemalans | 8.6 /100 | #219 | Tragic 35.5% |
| Immigrants | Bahamas | 8.3 /100 | #220 | Tragic 35.5% |
| Turks | 7.3 /100 | #221 | Tragic 35.4% |
| Immigrants | Ghana | 7.3 /100 | #222 | Tragic 35.4% |
| Ghanaians | 6.5 /100 | #223 | Tragic 35.3% |
| Hondurans | 6.5 /100 | #224 | Tragic 35.3% |
| Immigrants | Belgium | 6.1 /100 | #225 | Tragic 35.3% |
| Immigrants | Guatemala | 5.7 /100 | #226 | Tragic 35.3% |
| Mongolians | 5.7 /100 | #227 | Tragic 35.3% |