Immigrants from Dominican Republic vs Cambodian In Labor Force | Age 20-24
COMPARE
Immigrants from Dominican Republic
Cambodian
In Labor Force | Age 20-24
In Labor Force | Age 20-24 Comparison
Immigrants from Dominican Republic
Cambodians
71.2%
IN LABOR FORCE | AGE 20-24
0.0/ 100
METRIC RATING
324th/ 347
METRIC RANK
75.2%
IN LABOR FORCE | AGE 20-24
60.5/ 100
METRIC RATING
166th/ 347
METRIC RANK
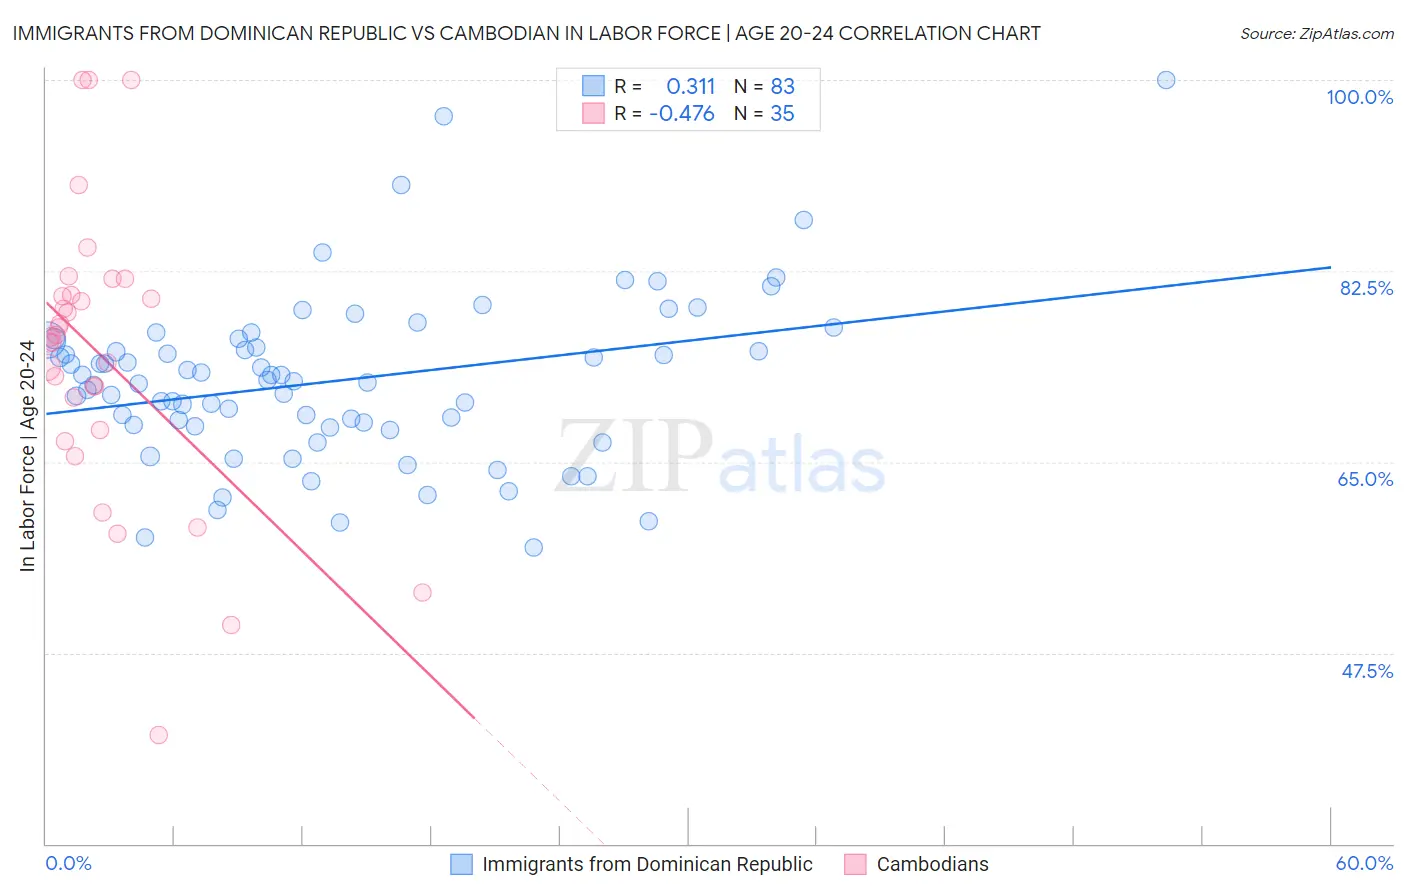
Immigrants from Dominican Republic vs Cambodian In Labor Force | Age 20-24 Correlation Chart
The statistical analysis conducted on geographies consisting of 275,100,632 people shows a mild positive correlation between the proportion of Immigrants from Dominican Republic and labor force participation rate among population between the ages 20 and 24 in the United States with a correlation coefficient (R) of 0.311 and weighted average of 71.2%. Similarly, the statistical analysis conducted on geographies consisting of 102,513,868 people shows a moderate negative correlation between the proportion of Cambodians and labor force participation rate among population between the ages 20 and 24 in the United States with a correlation coefficient (R) of -0.476 and weighted average of 75.2%, a difference of 5.6%.
In Labor Force | Age 20-24 Correlation Summary
| Measurement | Immigrants from Dominican Republic | Cambodian |
| Minimum | 57.1% | 40.0% |
| Maximum | 100.0% | 100.0% |
| Range | 42.9% | 60.0% |
| Mean | 72.4% | 74.7% |
| Median | 72.4% | 76.5% |
| Interquartile 25% (IQ1) | 68.2% | 68.0% |
| Interquartile 75% (IQ3) | 76.1% | 80.3% |
| Interquartile Range (IQR) | 7.9% | 12.4% |
| Standard Deviation (Sample) | 7.6% | 13.1% |
| Standard Deviation (Population) | 7.6% | 12.9% |
Similar Demographics by In Labor Force | Age 20-24
Demographics Similar to Immigrants from Dominican Republic by In Labor Force | Age 20-24
In terms of in labor force | age 20-24, the demographic groups most similar to Immigrants from Dominican Republic are West Indian (71.3%, a difference of 0.090%), Barbadian (71.1%, a difference of 0.11%), Dominican (71.1%, a difference of 0.19%), Immigrants from Trinidad and Tobago (71.1%, a difference of 0.19%), and Immigrants from China (71.1%, a difference of 0.21%).
| Demographics | Rating | Rank | In Labor Force | Age 20-24 |
| Immigrants | Armenia | 0.0 /100 | #317 | Tragic 71.7% |
| Immigrants | Hong Kong | 0.0 /100 | #318 | Tragic 71.6% |
| Immigrants | Israel | 0.0 /100 | #319 | Tragic 71.6% |
| Trinidadians and Tobagonians | 0.0 /100 | #320 | Tragic 71.5% |
| Immigrants | Taiwan | 0.0 /100 | #321 | Tragic 71.5% |
| Filipinos | 0.0 /100 | #322 | Tragic 71.4% |
| West Indians | 0.0 /100 | #323 | Tragic 71.3% |
| Immigrants | Dominican Republic | 0.0 /100 | #324 | Tragic 71.2% |
| Barbadians | 0.0 /100 | #325 | Tragic 71.1% |
| Dominicans | 0.0 /100 | #326 | Tragic 71.1% |
| Immigrants | Trinidad and Tobago | 0.0 /100 | #327 | Tragic 71.1% |
| Immigrants | China | 0.0 /100 | #328 | Tragic 71.1% |
| Yup'ik | 0.0 /100 | #329 | Tragic 70.9% |
| Vietnamese | 0.0 /100 | #330 | Tragic 70.6% |
| Immigrants | Bangladesh | 0.0 /100 | #331 | Tragic 70.6% |
Demographics Similar to Cambodians by In Labor Force | Age 20-24
In terms of in labor force | age 20-24, the demographic groups most similar to Cambodians are Immigrants from South Eastern Asia (75.1%, a difference of 0.040%), Bolivian (75.2%, a difference of 0.050%), Afghan (75.2%, a difference of 0.050%), Immigrants from Romania (75.2%, a difference of 0.060%), and Costa Rican (75.2%, a difference of 0.060%).
| Demographics | Rating | Rank | In Labor Force | Age 20-24 |
| South American Indians | 69.0 /100 | #159 | Good 75.3% |
| Japanese | 68.7 /100 | #160 | Good 75.3% |
| New Zealanders | 65.4 /100 | #161 | Good 75.2% |
| Immigrants | Romania | 64.6 /100 | #162 | Good 75.2% |
| Costa Ricans | 64.2 /100 | #163 | Good 75.2% |
| Bolivians | 64.0 /100 | #164 | Good 75.2% |
| Afghans | 63.5 /100 | #165 | Good 75.2% |
| Cambodians | 60.5 /100 | #166 | Good 75.2% |
| Immigrants | South Eastern Asia | 57.5 /100 | #167 | Average 75.1% |
| Immigrants | Western Africa | 56.7 /100 | #168 | Average 75.1% |
| Immigrants | Philippines | 55.8 /100 | #169 | Average 75.1% |
| Mexicans | 52.1 /100 | #170 | Average 75.1% |
| Cajuns | 51.1 /100 | #171 | Average 75.1% |
| Yakama | 50.8 /100 | #172 | Average 75.1% |
| Immigrants | Croatia | 50.2 /100 | #173 | Average 75.1% |