Immigrants from Dominican Republic vs Immigrants from Canada In Labor Force | Age 20-24
COMPARE
Immigrants from Dominican Republic
Immigrants from Canada
In Labor Force | Age 20-24
In Labor Force | Age 20-24 Comparison
Immigrants from Dominican Republic
Immigrants from Canada
71.2%
IN LABOR FORCE | AGE 20-24
0.0/ 100
METRIC RATING
324th/ 347
METRIC RANK
75.9%
IN LABOR FORCE | AGE 20-24
95.6/ 100
METRIC RATING
112th/ 347
METRIC RANK
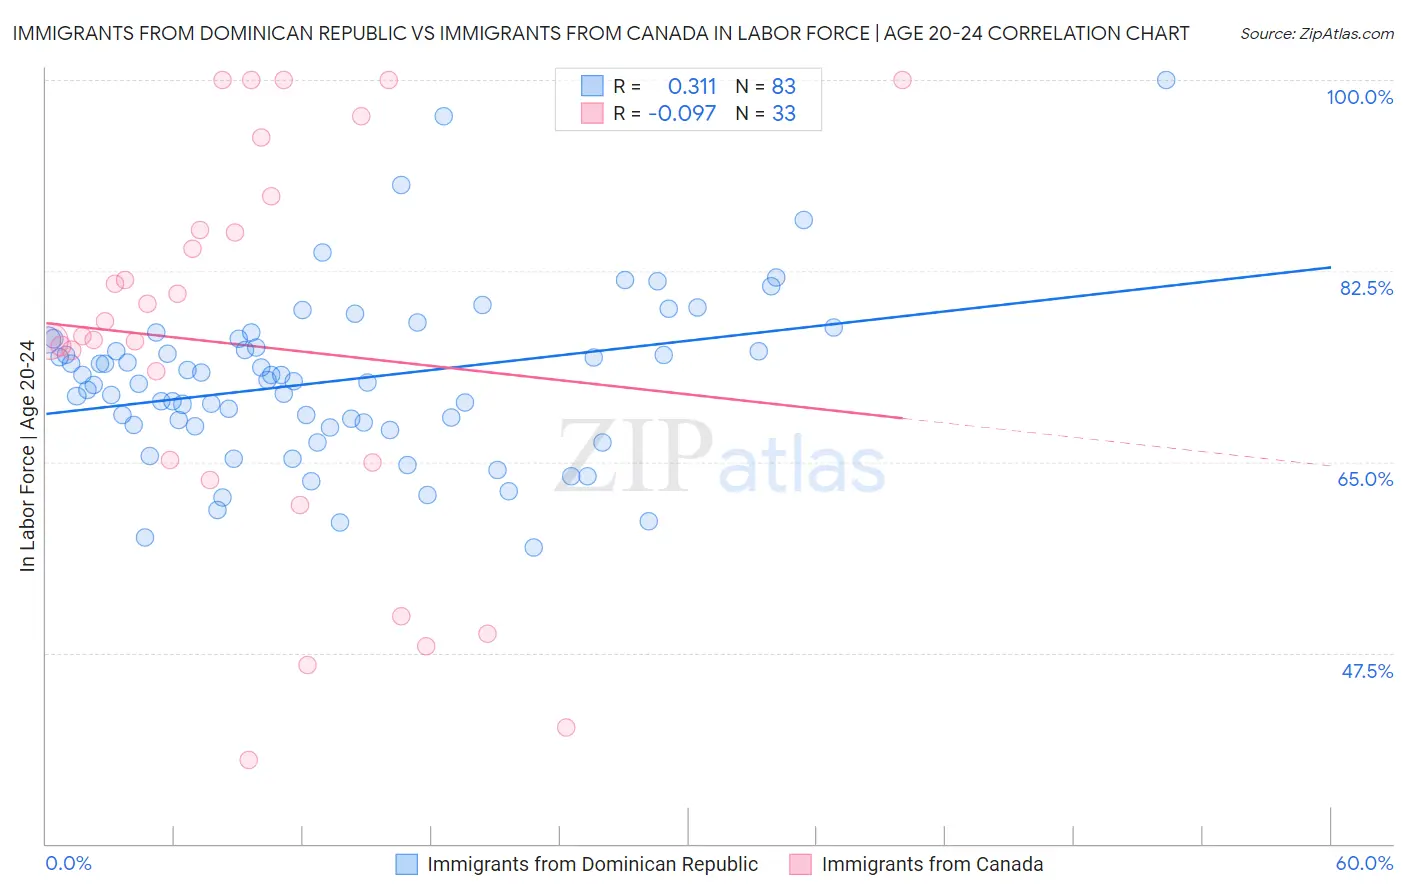
Immigrants from Dominican Republic vs Immigrants from Canada In Labor Force | Age 20-24 Correlation Chart
The statistical analysis conducted on geographies consisting of 275,100,632 people shows a mild positive correlation between the proportion of Immigrants from Dominican Republic and labor force participation rate among population between the ages 20 and 24 in the United States with a correlation coefficient (R) of 0.311 and weighted average of 71.2%. Similarly, the statistical analysis conducted on geographies consisting of 458,968,700 people shows a slight negative correlation between the proportion of Immigrants from Canada and labor force participation rate among population between the ages 20 and 24 in the United States with a correlation coefficient (R) of -0.097 and weighted average of 75.9%, a difference of 6.6%.
In Labor Force | Age 20-24 Correlation Summary
| Measurement | Immigrants from Dominican Republic | Immigrants from Canada |
| Minimum | 57.1% | 37.7% |
| Maximum | 100.0% | 100.0% |
| Range | 42.9% | 62.3% |
| Mean | 72.4% | 75.6% |
| Median | 72.4% | 76.5% |
| Interquartile 25% (IQ1) | 68.2% | 64.1% |
| Interquartile 75% (IQ3) | 76.1% | 87.8% |
| Interquartile Range (IQR) | 7.9% | 23.6% |
| Standard Deviation (Sample) | 7.6% | 18.2% |
| Standard Deviation (Population) | 7.6% | 17.9% |
Similar Demographics by In Labor Force | Age 20-24
Demographics Similar to Immigrants from Dominican Republic by In Labor Force | Age 20-24
In terms of in labor force | age 20-24, the demographic groups most similar to Immigrants from Dominican Republic are West Indian (71.3%, a difference of 0.090%), Barbadian (71.1%, a difference of 0.11%), Dominican (71.1%, a difference of 0.19%), Immigrants from Trinidad and Tobago (71.1%, a difference of 0.19%), and Immigrants from China (71.1%, a difference of 0.21%).
| Demographics | Rating | Rank | In Labor Force | Age 20-24 |
| Immigrants | Armenia | 0.0 /100 | #317 | Tragic 71.7% |
| Immigrants | Hong Kong | 0.0 /100 | #318 | Tragic 71.6% |
| Immigrants | Israel | 0.0 /100 | #319 | Tragic 71.6% |
| Trinidadians and Tobagonians | 0.0 /100 | #320 | Tragic 71.5% |
| Immigrants | Taiwan | 0.0 /100 | #321 | Tragic 71.5% |
| Filipinos | 0.0 /100 | #322 | Tragic 71.4% |
| West Indians | 0.0 /100 | #323 | Tragic 71.3% |
| Immigrants | Dominican Republic | 0.0 /100 | #324 | Tragic 71.2% |
| Barbadians | 0.0 /100 | #325 | Tragic 71.1% |
| Dominicans | 0.0 /100 | #326 | Tragic 71.1% |
| Immigrants | Trinidad and Tobago | 0.0 /100 | #327 | Tragic 71.1% |
| Immigrants | China | 0.0 /100 | #328 | Tragic 71.1% |
| Yup'ik | 0.0 /100 | #329 | Tragic 70.9% |
| Vietnamese | 0.0 /100 | #330 | Tragic 70.6% |
| Immigrants | Bangladesh | 0.0 /100 | #331 | Tragic 70.6% |
Demographics Similar to Immigrants from Canada by In Labor Force | Age 20-24
In terms of in labor force | age 20-24, the demographic groups most similar to Immigrants from Canada are Ukrainian (75.9%, a difference of 0.010%), Cherokee (75.9%, a difference of 0.020%), Immigrants from Morocco (75.9%, a difference of 0.020%), Immigrants from Netherlands (75.9%, a difference of 0.030%), and Immigrants from Zimbabwe (75.9%, a difference of 0.040%).
| Demographics | Rating | Rank | In Labor Force | Age 20-24 |
| Immigrants | Nepal | 97.2 /100 | #105 | Exceptional 76.0% |
| Immigrants | Uganda | 97.1 /100 | #106 | Exceptional 76.0% |
| Greeks | 96.9 /100 | #107 | Exceptional 76.0% |
| Iraqis | 96.6 /100 | #108 | Exceptional 76.0% |
| Cherokee | 95.8 /100 | #109 | Exceptional 75.9% |
| Immigrants | Morocco | 95.8 /100 | #110 | Exceptional 75.9% |
| Ukrainians | 95.7 /100 | #111 | Exceptional 75.9% |
| Immigrants | Canada | 95.6 /100 | #112 | Exceptional 75.9% |
| Immigrants | Netherlands | 95.3 /100 | #113 | Exceptional 75.9% |
| Immigrants | Zimbabwe | 95.1 /100 | #114 | Exceptional 75.9% |
| Alaska Natives | 95.1 /100 | #115 | Exceptional 75.9% |
| Immigrants | North America | 95.0 /100 | #116 | Exceptional 75.9% |
| Assyrians/Chaldeans/Syriacs | 94.9 /100 | #117 | Exceptional 75.9% |
| Spanish Americans | 94.8 /100 | #118 | Exceptional 75.8% |
| Immigrants | Portugal | 94.8 /100 | #119 | Exceptional 75.8% |