Immigrants from Dominican Republic vs German In Labor Force | Age 20-24
COMPARE
Immigrants from Dominican Republic
German
In Labor Force | Age 20-24
In Labor Force | Age 20-24 Comparison
Immigrants from Dominican Republic
Germans
71.2%
IN LABOR FORCE | AGE 20-24
0.0/ 100
METRIC RATING
324th/ 347
METRIC RANK
78.6%
IN LABOR FORCE | AGE 20-24
100.0/ 100
METRIC RATING
12th/ 347
METRIC RANK
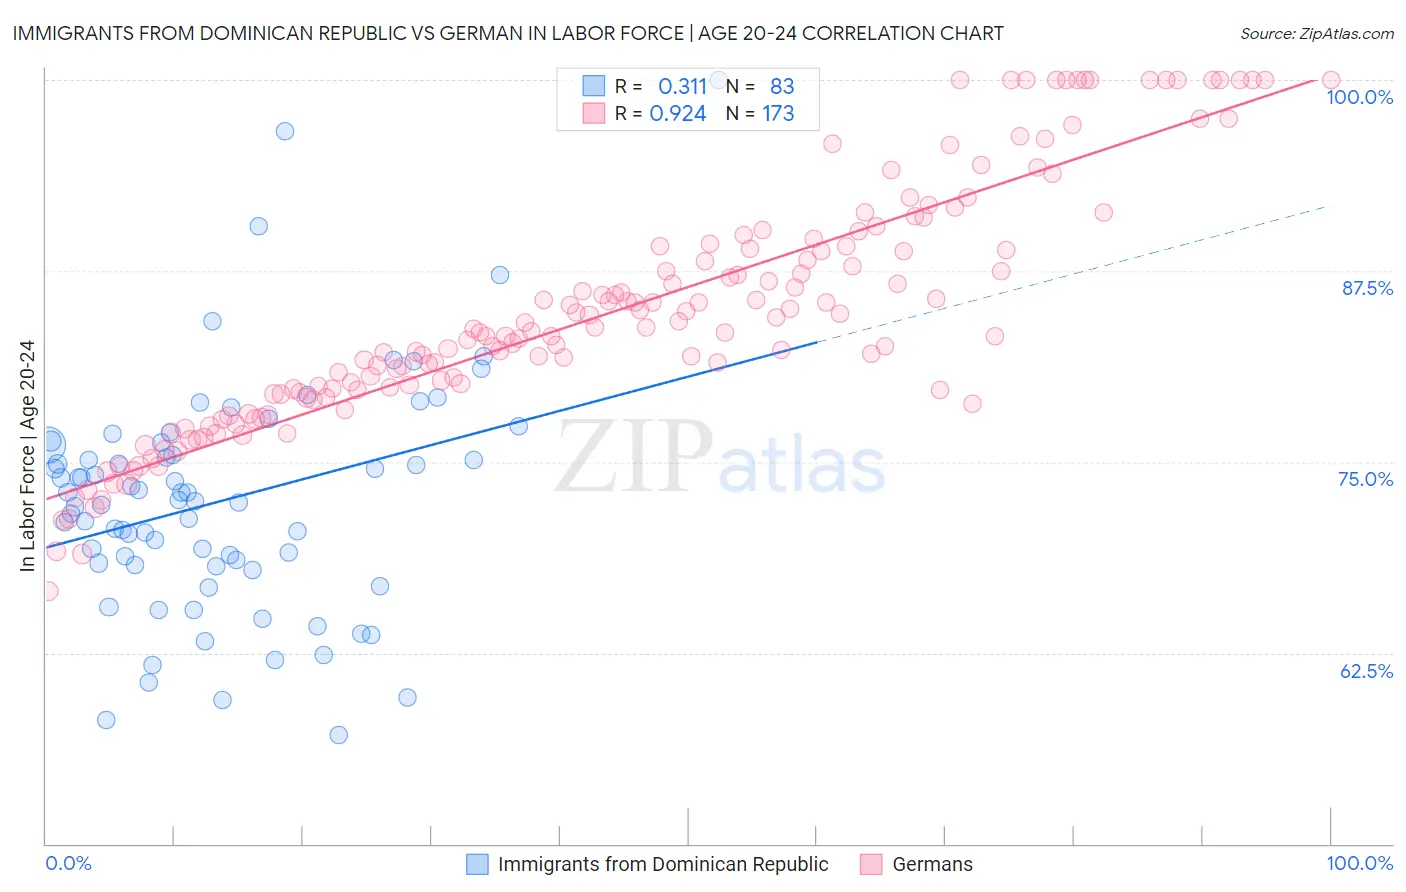
Immigrants from Dominican Republic vs German In Labor Force | Age 20-24 Correlation Chart
The statistical analysis conducted on geographies consisting of 275,100,632 people shows a mild positive correlation between the proportion of Immigrants from Dominican Republic and labor force participation rate among population between the ages 20 and 24 in the United States with a correlation coefficient (R) of 0.311 and weighted average of 71.2%. Similarly, the statistical analysis conducted on geographies consisting of 578,744,060 people shows a near-perfect positive correlation between the proportion of Germans and labor force participation rate among population between the ages 20 and 24 in the United States with a correlation coefficient (R) of 0.924 and weighted average of 78.6%, a difference of 10.4%.
In Labor Force | Age 20-24 Correlation Summary
| Measurement | Immigrants from Dominican Republic | German |
| Minimum | 57.1% | 66.5% |
| Maximum | 100.0% | 100.0% |
| Range | 42.9% | 33.5% |
| Mean | 72.4% | 84.7% |
| Median | 72.4% | 83.6% |
| Interquartile 25% (IQ1) | 68.2% | 79.5% |
| Interquartile 75% (IQ3) | 76.1% | 89.1% |
| Interquartile Range (IQR) | 7.9% | 9.6% |
| Standard Deviation (Sample) | 7.6% | 7.8% |
| Standard Deviation (Population) | 7.6% | 7.8% |
Similar Demographics by In Labor Force | Age 20-24
Demographics Similar to Immigrants from Dominican Republic by In Labor Force | Age 20-24
In terms of in labor force | age 20-24, the demographic groups most similar to Immigrants from Dominican Republic are West Indian (71.3%, a difference of 0.090%), Barbadian (71.1%, a difference of 0.11%), Dominican (71.1%, a difference of 0.19%), Immigrants from Trinidad and Tobago (71.1%, a difference of 0.19%), and Immigrants from China (71.1%, a difference of 0.21%).
| Demographics | Rating | Rank | In Labor Force | Age 20-24 |
| Immigrants | Armenia | 0.0 /100 | #317 | Tragic 71.7% |
| Immigrants | Hong Kong | 0.0 /100 | #318 | Tragic 71.6% |
| Immigrants | Israel | 0.0 /100 | #319 | Tragic 71.6% |
| Trinidadians and Tobagonians | 0.0 /100 | #320 | Tragic 71.5% |
| Immigrants | Taiwan | 0.0 /100 | #321 | Tragic 71.5% |
| Filipinos | 0.0 /100 | #322 | Tragic 71.4% |
| West Indians | 0.0 /100 | #323 | Tragic 71.3% |
| Immigrants | Dominican Republic | 0.0 /100 | #324 | Tragic 71.2% |
| Barbadians | 0.0 /100 | #325 | Tragic 71.1% |
| Dominicans | 0.0 /100 | #326 | Tragic 71.1% |
| Immigrants | Trinidad and Tobago | 0.0 /100 | #327 | Tragic 71.1% |
| Immigrants | China | 0.0 /100 | #328 | Tragic 71.1% |
| Yup'ik | 0.0 /100 | #329 | Tragic 70.9% |
| Vietnamese | 0.0 /100 | #330 | Tragic 70.6% |
| Immigrants | Bangladesh | 0.0 /100 | #331 | Tragic 70.6% |
Demographics Similar to Germans by In Labor Force | Age 20-24
In terms of in labor force | age 20-24, the demographic groups most similar to Germans are Scandinavian (78.5%, a difference of 0.070%), Czech (78.5%, a difference of 0.070%), Finnish (78.7%, a difference of 0.11%), Slovene (78.7%, a difference of 0.15%), and Sudanese (78.4%, a difference of 0.21%).
| Demographics | Rating | Rank | In Labor Force | Age 20-24 |
| Aleuts | 100.0 /100 | #5 | Exceptional 79.0% |
| Danes | 100.0 /100 | #6 | Exceptional 79.0% |
| Luxembourgers | 100.0 /100 | #7 | Exceptional 79.0% |
| Immigrants | Cabo Verde | 100.0 /100 | #8 | Exceptional 78.9% |
| Swedes | 100.0 /100 | #9 | Exceptional 78.8% |
| Slovenes | 100.0 /100 | #10 | Exceptional 78.7% |
| Finns | 100.0 /100 | #11 | Exceptional 78.7% |
| Germans | 100.0 /100 | #12 | Exceptional 78.6% |
| Scandinavians | 100.0 /100 | #13 | Exceptional 78.5% |
| Czechs | 100.0 /100 | #14 | Exceptional 78.5% |
| Sudanese | 100.0 /100 | #15 | Exceptional 78.4% |
| Dutch | 100.0 /100 | #16 | Exceptional 78.4% |
| Cape Verdeans | 100.0 /100 | #17 | Exceptional 78.3% |
| Immigrants | Bosnia and Herzegovina | 100.0 /100 | #18 | Exceptional 78.1% |
| Bangladeshis | 100.0 /100 | #19 | Exceptional 78.1% |