Immigrants from Dominican Republic vs Immigrants from Russia In Labor Force | Age 20-24
COMPARE
Immigrants from Dominican Republic
Immigrants from Russia
In Labor Force | Age 20-24
In Labor Force | Age 20-24 Comparison
Immigrants from Dominican Republic
Immigrants from Russia
71.2%
IN LABOR FORCE | AGE 20-24
0.0/ 100
METRIC RATING
324th/ 347
METRIC RANK
73.5%
IN LABOR FORCE | AGE 20-24
0.3/ 100
METRIC RATING
270th/ 347
METRIC RANK
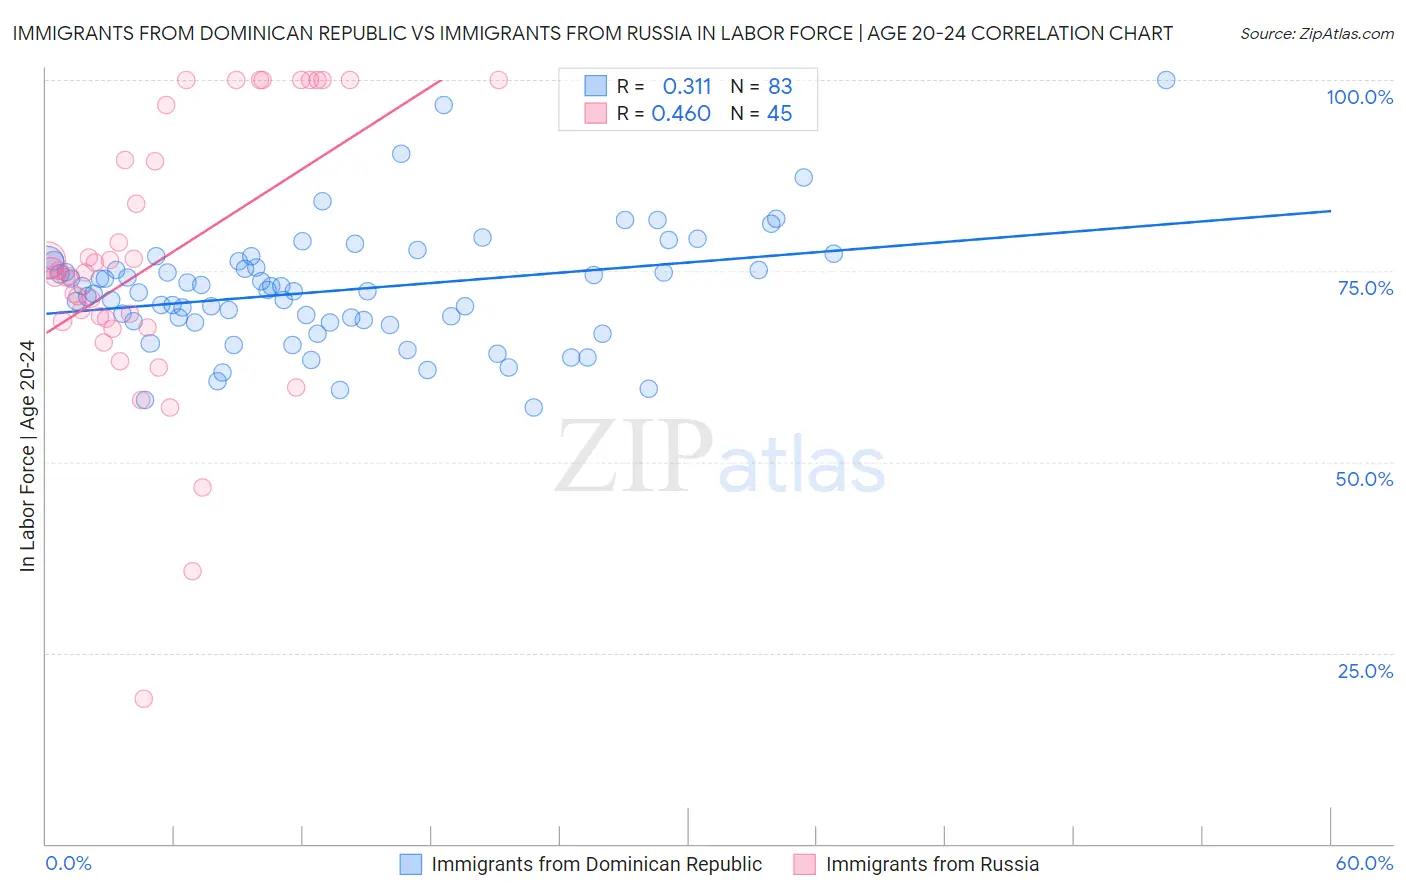
Immigrants from Dominican Republic vs Immigrants from Russia In Labor Force | Age 20-24 Correlation Chart
The statistical analysis conducted on geographies consisting of 275,100,632 people shows a mild positive correlation between the proportion of Immigrants from Dominican Republic and labor force participation rate among population between the ages 20 and 24 in the United States with a correlation coefficient (R) of 0.311 and weighted average of 71.2%. Similarly, the statistical analysis conducted on geographies consisting of 347,833,174 people shows a moderate positive correlation between the proportion of Immigrants from Russia and labor force participation rate among population between the ages 20 and 24 in the United States with a correlation coefficient (R) of 0.460 and weighted average of 73.5%, a difference of 3.2%.
In Labor Force | Age 20-24 Correlation Summary
| Measurement | Immigrants from Dominican Republic | Immigrants from Russia |
| Minimum | 57.1% | 19.0% |
| Maximum | 100.0% | 100.0% |
| Range | 42.9% | 81.0% |
| Mean | 72.4% | 76.3% |
| Median | 72.4% | 74.8% |
| Interquartile 25% (IQ1) | 68.2% | 68.0% |
| Interquartile 75% (IQ3) | 76.1% | 93.2% |
| Interquartile Range (IQR) | 7.9% | 25.2% |
| Standard Deviation (Sample) | 7.6% | 18.0% |
| Standard Deviation (Population) | 7.6% | 17.8% |
Similar Demographics by In Labor Force | Age 20-24
Demographics Similar to Immigrants from Dominican Republic by In Labor Force | Age 20-24
In terms of in labor force | age 20-24, the demographic groups most similar to Immigrants from Dominican Republic are West Indian (71.3%, a difference of 0.090%), Barbadian (71.1%, a difference of 0.11%), Dominican (71.1%, a difference of 0.19%), Immigrants from Trinidad and Tobago (71.1%, a difference of 0.19%), and Immigrants from China (71.1%, a difference of 0.21%).
| Demographics | Rating | Rank | In Labor Force | Age 20-24 |
| Immigrants | Armenia | 0.0 /100 | #317 | Tragic 71.7% |
| Immigrants | Hong Kong | 0.0 /100 | #318 | Tragic 71.6% |
| Immigrants | Israel | 0.0 /100 | #319 | Tragic 71.6% |
| Trinidadians and Tobagonians | 0.0 /100 | #320 | Tragic 71.5% |
| Immigrants | Taiwan | 0.0 /100 | #321 | Tragic 71.5% |
| Filipinos | 0.0 /100 | #322 | Tragic 71.4% |
| West Indians | 0.0 /100 | #323 | Tragic 71.3% |
| Immigrants | Dominican Republic | 0.0 /100 | #324 | Tragic 71.2% |
| Barbadians | 0.0 /100 | #325 | Tragic 71.1% |
| Dominicans | 0.0 /100 | #326 | Tragic 71.1% |
| Immigrants | Trinidad and Tobago | 0.0 /100 | #327 | Tragic 71.1% |
| Immigrants | China | 0.0 /100 | #328 | Tragic 71.1% |
| Yup'ik | 0.0 /100 | #329 | Tragic 70.9% |
| Vietnamese | 0.0 /100 | #330 | Tragic 70.6% |
| Immigrants | Bangladesh | 0.0 /100 | #331 | Tragic 70.6% |
Demographics Similar to Immigrants from Russia by In Labor Force | Age 20-24
In terms of in labor force | age 20-24, the demographic groups most similar to Immigrants from Russia are Colombian (73.5%, a difference of 0.030%), Immigrants from Indonesia (73.4%, a difference of 0.050%), South American (73.5%, a difference of 0.060%), Belizean (73.4%, a difference of 0.060%), and Cheyenne (73.4%, a difference of 0.090%).
| Demographics | Rating | Rank | In Labor Force | Age 20-24 |
| Immigrants | Asia | 0.5 /100 | #263 | Tragic 73.6% |
| Immigrants | Haiti | 0.5 /100 | #264 | Tragic 73.6% |
| Burmese | 0.5 /100 | #265 | Tragic 73.6% |
| Haitians | 0.5 /100 | #266 | Tragic 73.6% |
| Immigrants | Western Asia | 0.4 /100 | #267 | Tragic 73.5% |
| South Americans | 0.4 /100 | #268 | Tragic 73.5% |
| Colombians | 0.3 /100 | #269 | Tragic 73.5% |
| Immigrants | Russia | 0.3 /100 | #270 | Tragic 73.5% |
| Immigrants | Indonesia | 0.3 /100 | #271 | Tragic 73.4% |
| Belizeans | 0.3 /100 | #272 | Tragic 73.4% |
| Cheyenne | 0.2 /100 | #273 | Tragic 73.4% |
| Immigrants | Colombia | 0.2 /100 | #274 | Tragic 73.4% |
| Immigrants | South America | 0.2 /100 | #275 | Tragic 73.3% |
| Mongolians | 0.2 /100 | #276 | Tragic 73.3% |
| Immigrants | Malaysia | 0.2 /100 | #277 | Tragic 73.3% |